Polaris at Tour de Branch explained - Python programmable vehicle tracker
Follow article
 Dave from DesignSpark
How do you feel about this article? Help us to provide better content for you.
Dave from DesignSpark
Thank you! Your feedback has been received.
Dave from DesignSpark
There was a problem submitting your feedback, please try again later.
Dave from DesignSpark
What do you think of this article?

Two Polaris boards tracked the RS Components team across the whole of the UK, from Aberdeen to London. The team collected £250,000 for Children with Cancer UK. While Polaris did its part by collecting weather and air quality data. Learn how we did it.
After the success of the Tour de Branch fundraiser race across the UK, we’ve prepared an article that explains how the Python-programmable boards successfully tracked multiple vehicles, from one dashboard.
So, how did we do it?
Well, with two Zerynth-powered, Python programmable Polaris boards, equipped with a MikroE Environment click (168-2993) and Air Quality 5 click.
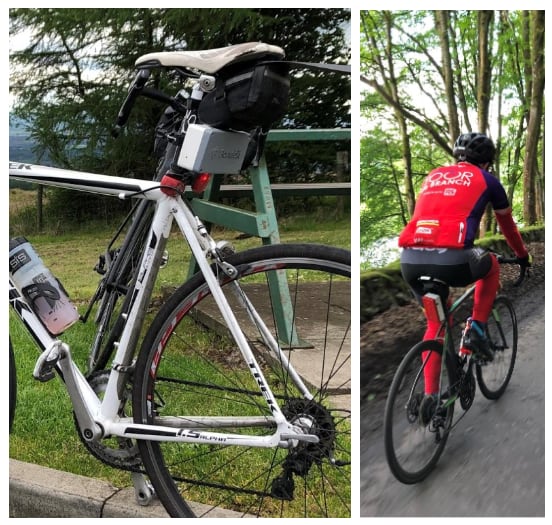
During the 12 days of Tour de Branch, two Polaris boards were added to two bicycles, and thanks to it everyone was able to track the RS team while they were on the road, what the weather conditions were, and what the state of air quality was.
As you can see from the images, both the casing and Polaris are conveniently small. They fit perfectly on the back of the bike. The casing for Polaris and the rest of the equipment was made especially for the race with DesignSpark Mechanical Software. You can print it at home if you want since the source file is available for download on GitHub.
The hardware
The hardware we used was:
- 2 Polaris boards, for instance, the 3G version (Fortebit P/N: POL-3G)
- 2 Polaris external antennas (Fortebit P/N: OT2-AN)
- 2 LiPo batteries, for instance, the 2500 mAh battery included in the Polaris 3G kit with battery (this kit includes: Polaris 3G board, aluminum case, GPS/Glonass/GSM antenna, main connector cable, and 2500 mAh LiPo battery)
- 2 Click Boards: the “Air quality 5 click” in one box and the “Environment click” on the other box
- 2 Bivar Light Pipe models PLP2-750 (713-4725)
- 2 connectors for charging, Lumberg 1610 05 (124-8897)
- 20 M3 screws (8mm length) and 20 expansion inserts (027-8534)
- 2 3D printed boxes (Top and Bottom), see below for details
We’re glad to let you know that Polaris will be available in the Fortebit shop soon
The code
Polaris is powered by Zerynth and is programmable in Python. The Python code developed for the RS tour de Branch reads sensor data from onboard and external sensors and sends them to the Fortebit Cloud every 5 seconds.
Data from onboard sensors are battery level, IMU roll and pitch angles, and GPS position and speed.
Data from external sensors are air temperature, humidity, and pressure or NO2, CO and NH3 depending on the click board mounted.
The Polaris is provided with a SIM card: the code connects to the internet by establishing a 3G connection with the internet service provider using the Python Zerynth modem library.
Once the connection is established the code sends acquired data to the Fortebit Cloud using the IoT Fortebit Cloud Python library based on the MQTT protocol.
The Python source code of this demo is available to download on GitHub.
The dashboard
In the following images, you can see how the dashboard looked during the race. Thanks to Polaris everyone was able to precisely track the two bicycles, at all times. We knew how fast they were going, and if they were close to one another, and how far they were from the next RS branch.

One Polaris board collected and displayed temperature, humidity, and pressure data, while the other one reported the air quality
The dashboard also reported the state of the battery for each board and if the battery was charging, not charging or fully charged.
In the dashboard, Polaris RS 1 had a red icon on the map, Polaris RS 2 had a grey icon, to match their real cover top color.
The label on top of the position marker on the map was:
- Blue if the device was sending data
- Yellow if no data had arrived in the last minute
- Red if no data was received in the last hour.
The map on the left showed the last known position of the devices, whether they were sending data or not.
The right side of the screen was divided into two sections showing some of the latest telemetry data: speed and battery indicators for both devices and sensor data for each device.
Clicking on the device icon on the map, or the small button on the right of the device sections title, moved to the second dashboard page where data history was shown.

Here you could see the route on the map, relative to the selected time frame (clock button on the top right corner), and also some charts of the telemetry data.
You could also quickly change the current device by clicking its row of the table on top of the page, the latest data was also shown there.
Soon, we will offer a Cloud service for fleet management that’s as easy to use as the one above.
Data collected during the Tour de Branch
All raw collected data are available on GitHub:
https://github.com/fortebit/Polaris_Tour_de_branch_Data
Gas levels, shown in “ppm” concentration, are just qualitative indicators and cannot be compared with accurate measurements done with calibrated equipment.
DesignSpark Mechanical software bicycle case
We designed a special case for Polaris so that it fits on a GoPro handlebar mount like in the image below:

Thanks to the DesignSpark Mechanical software we quickly designed a 3D concept to let the airflow through the case and reach the Click Boards on top of the Polaris.
The top of the case holds the external antenna while the bottom holds the boards and battery. A light pipe has been used to bring the light of the Polaris board LED outside the case.
And here is the final result:
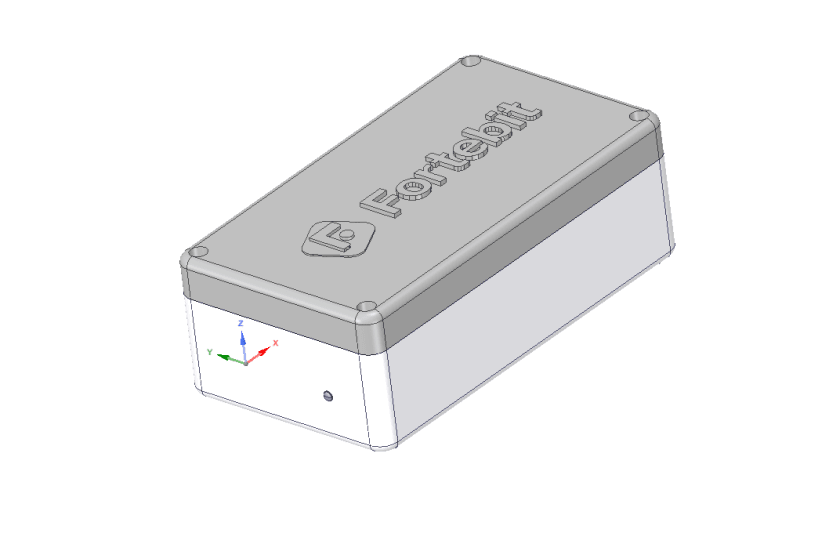

Of course, you can download the DSM file and modify it according to your needs or just print and replicate it with your 3D printer.
Resources
- Polaris Tracker (Fortebit website)
- Python source code (GitHub)
- DSM case design (GitHub)
- Collected RAW data (GitHub)
- DS Mechanical Software (DesignSpark)
- Zerynth IDE (DesignSpark)
Comments