The Interactive Air Quality Map Part 4: Building The Map
Follow article
 Dave from DesignSpark
How do you feel about this article? Help us to provide better content for you.
Dave from DesignSpark
Thank you! Your feedback has been received.
Dave from DesignSpark
There was a problem submitting your feedback, please try again later.
Dave from DesignSpark
What do you think of this article?
If you're following the interactive air quality map project, then you already have a sense of what the project is about, as well as a general idea of concepts that will constitute this map build, if not, I do recommend going through part 1 and 2 of this build series.
Modelling the Map
There are no two identical places on earth, every area on the map is unique, this is an important point to keep in mind throughout this build, seen as the process used to build a map cell will need to be repeated to make up the rest of the areas on the map.
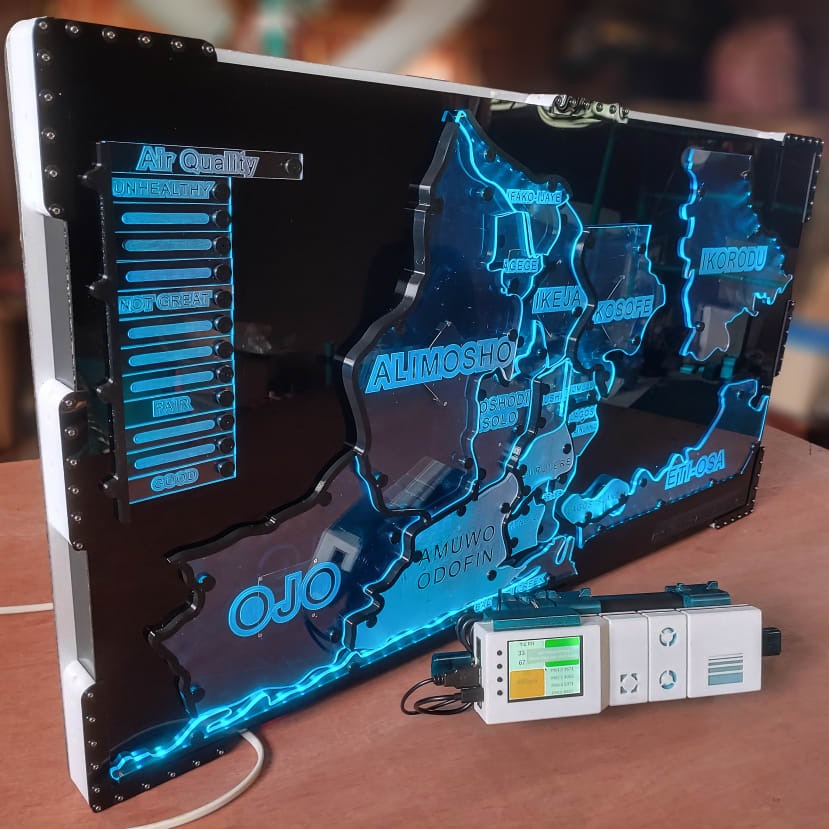
I am building the air quality map for Lagos, the state in Nigeria where I live, Lagos state has 18 main local government areas, so I’ll be making 18 map cells.
The first step I took was getting an image of the map of Lagos, which brings me to my First Tip - “Use a clean Map image”, google maps counterintuitively, is not a good source for an area image as far as the air quality map is concerned, although, I did eventually reference google maps for the one area (Ikorodu) that was not represented on the free stock image I got off of google, I happen to live in Ikorodu and I wasn't about to ignore it.

The next step is creating a vector outline of the areas on the map image, I found there's no real shortcut to this process, you just have to painstakingly trace the image out on a vector graphics software, I recommend Inkscape for this, but any vector graphics software should work the same.
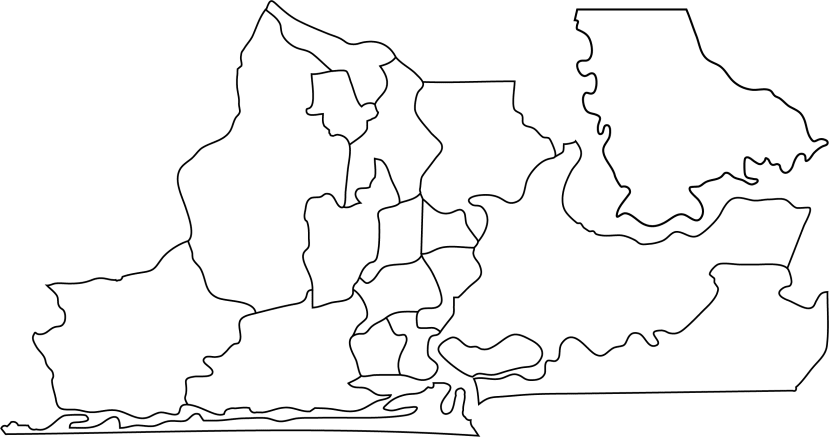
Tip 2 - “simplify the traced map outline”, this process reduces the number of points on the vector paths, doing this will greatly help throughout the modelling process and eventually in the machining process.
Once I had the vector graphics file as an SVG file, I imported it into fusion 360 to begin modelling the map, which brings me to the Third Tip - “Model Everything”, and I mean everything! I did not fully take this advice myself and it definitely came back to bite me in the behind, “18 times”.
My original design for the map cells involved a multi-layer edge lit stack up, similar to what you'll find inside LCD panels, you’ll see that in my first article, but when I eventually settled on the size I wanted for the map, I realized the smaller areas on the map will make the layered implementation quite difficult, so I decided to scale back to the simpler transparent edge lit acrylic design, also partly brought about by my explorations in article 3.
Cutting The Map
Before throwing all the map cells onto the CNC for cutting, I wanted to see how best to name the areas on the map, and see what looks best on the edge-lit acrylic, so I made two test cuts: in the first, the entire surface of the acrylic except the subject graphics is milled down about 0.2mm, in the second, the subject graphics is what's cut out, leaving most of the surface clear.
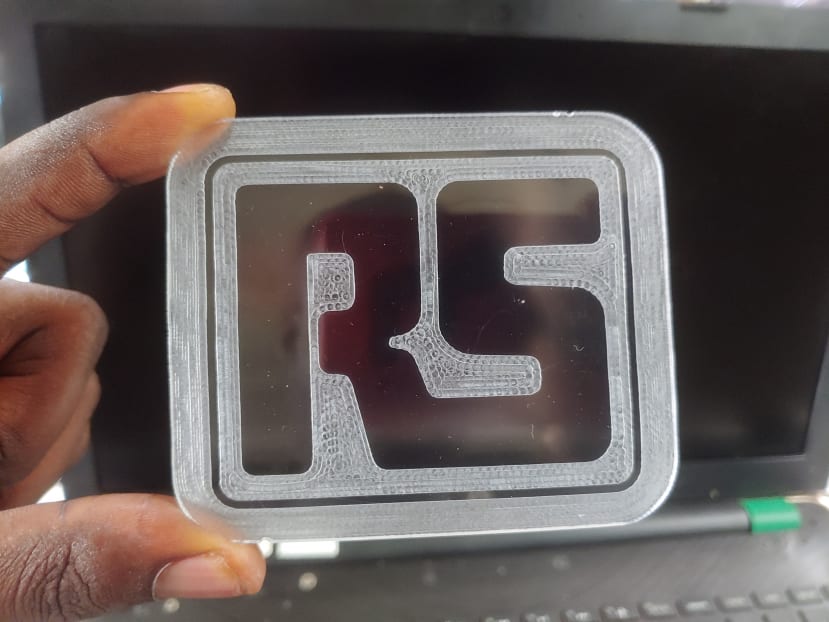

I convinced myself I liked the look of the RS logo better, and I also figured smudges and scratches will be better hidden if the entire surface except the text is cut. I initially modelled the area text on the map based on this choice, but I should mention that I am extremely new to CNC machining, new like, I just designed and built a CNC, my first! and this is my first project on it.
Once I was satisfied with the design of the entire map, I proceeded to cut the first area of the map, but first, I rearranged the cells on the map in a way that fits as many of them on my CNC’s build area.
Rethinking my Cutting Strategy
I was a few areas in, on the cutting process and I started to second guess my choice of cutting out the entire surface on each map cell, mostly because it was very machine intensive and was going to take way too long with the 1mm endmill I was using, also I noticed that the light wasn't travelling all the way through the first set of map cells I had cut, the lit edge looked significantly brighter than the rest of the cell’s surface.
After some more thinking, I decided to do an offset cut of the texts on the map, which is kind of a combination of the two cutting patterns I initially tested.
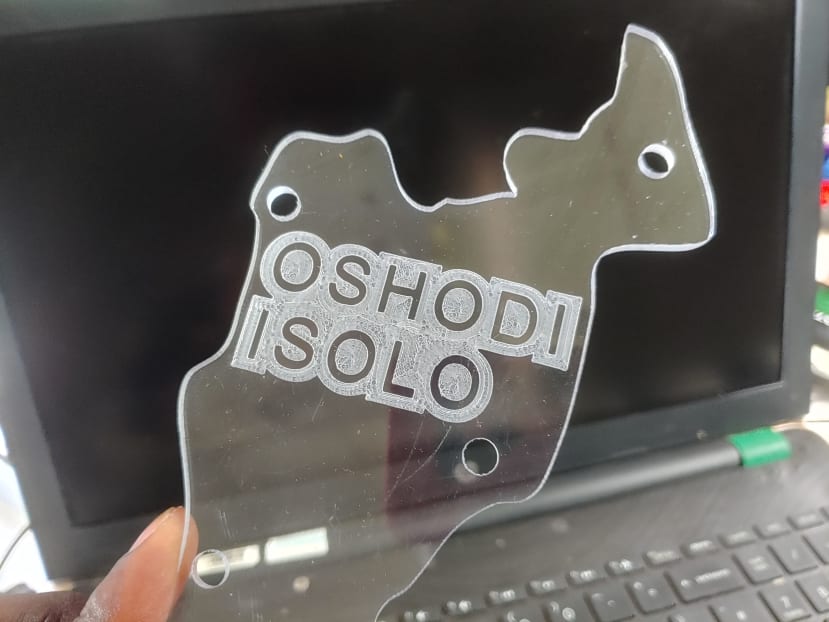
Offset text
3D Printing on The Map
The 3D printed parts on the map are mostly structural, they provide a way to secure the cells to the back acrylic panel, a way that doesn't involve screwing directly into the acrylic or using heat inserts, both of which can induce cracks in the acrylic.
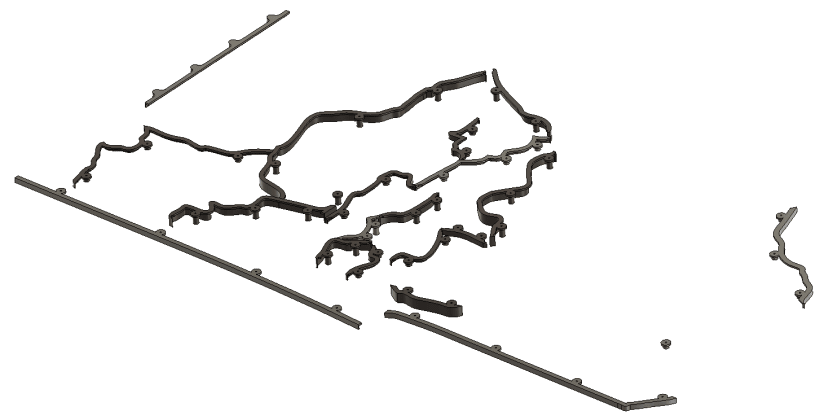
The edge parts hold the led strip right against the edges of the map cells, and also serve to partially obscure the illumination from those edges. Modelling these parts was a lot of work as each one had to be modelled individually on account of the areas being uniquely shaped.
Assembling the Map
The maps’ assembly was pretty straightforward, except I did not model and consequently machine all the required holes, specifically the holes for routing the wires through the back panel, so I had to drill them out manually, which was neither convenient nor pretty.
Tip 4 - “Have a microfiber cloth handy” or better still a pair of microfiber gloves, I checked, and they exist; the biggest problem I had during the assembly was keeping the map clean and smudge-free, it seemed like every time I touched the map, I left a permanent mark.
Sorting out Capacitive Proximity Sensing.
The project is titled Interactive Air Quality Map, the interactive part is made possible using capacitive touch pads which are the square PCBs you saw me install at the back of each cell on the map.
The sensing used on the map is self-capacitance sensing, which simply means each area on the map has a dedicated touchpad whose proximity is detected individually. I did experiment with mutual capacitance detection that would have allowed me to make the entire surface of the map responsive to touch.
This is essentially a bunch of touchpads arranged and connected in a grid pattern, much like how you'd connect push buttons in a grid to form a keypad, the advantage of mutual capacitance is more touch points per microcontroller pin. Unfortunately, I could not get it to work quite right at the scale of the air quality map.
The Capacitive Proximity Controller
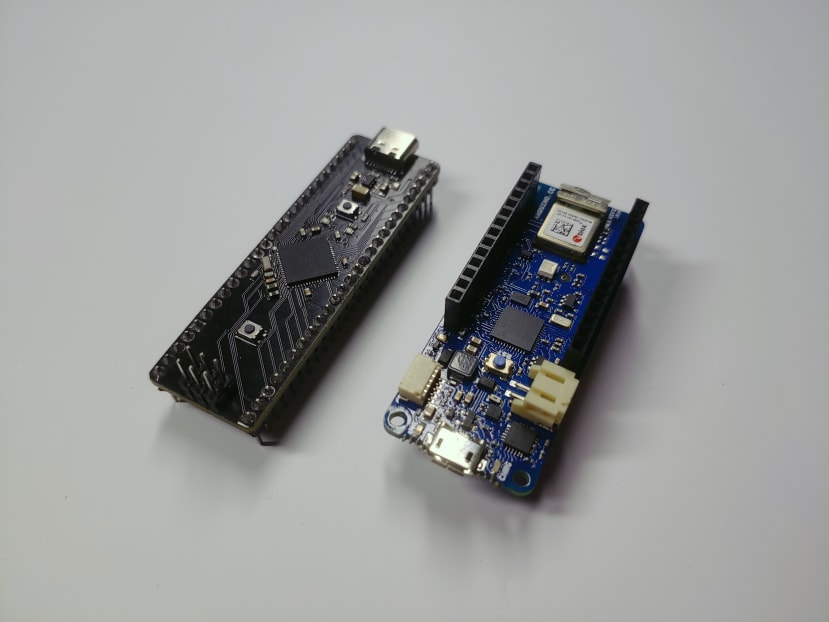
I originally planned to use an Arduino Zero board to control the proximity sensing on the map, as I demonstrated in part 1, I chose the zero because it features the ATSAMD21G18 chip, a microcontroller from Microchip that has a capacitive sensing module built-in, but I realized I had a different chip, the ATSAMD21J17 which I bought for a different project, this chip is part of the ATSAMD21 family of microcontrollers, so it also features a capacitive sensing module, with the added advantage of having more pins and hence more capacitive touch channels. I designed a very basic development board using this chip, I figured the board could be useful for more than just this map build, for me, and for any of you that might be interested in having the board manufactured for yourselves.
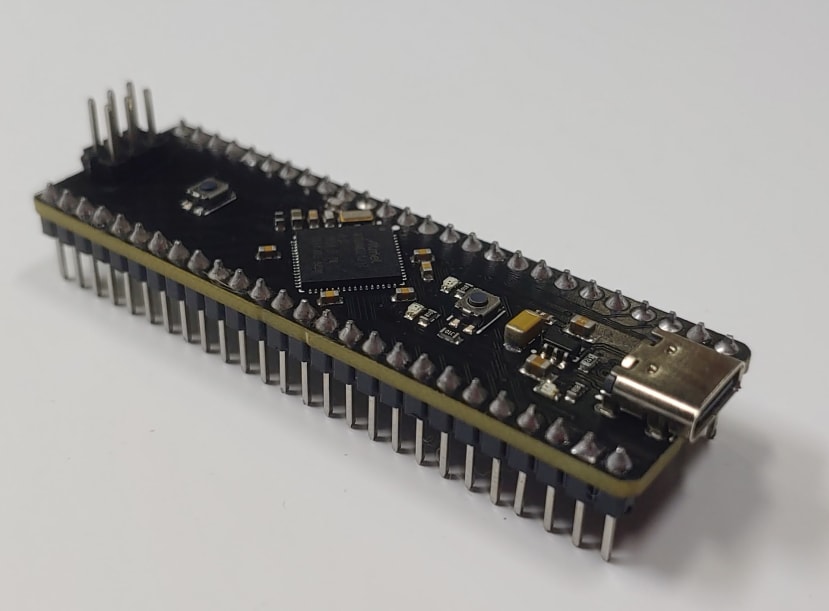
ATSAMD21J17 DEV BOARD (Capacitive touch controller)
You’ll find the schematic and the Gerber files on the GitHub repository.
Making Connections on the Map
Tip 5 - “make all your connections on a custom PCB if you can”, when you consider that every signal wired on the map has to be repeated multiple times (18 + 1 in my case), it just makes sense to make the connections on a PCB, I did not follow my own tip though, instead, I decided to make my connections on a prototyping board.
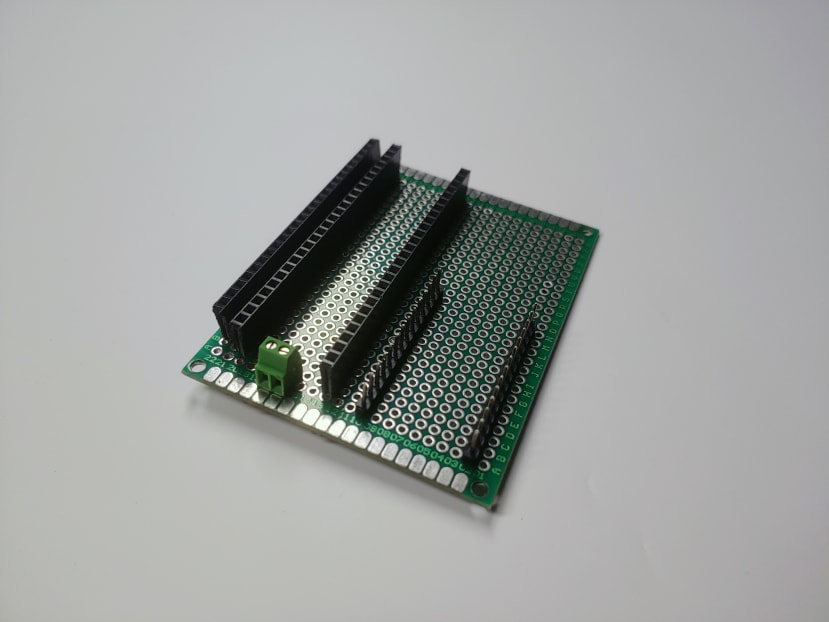
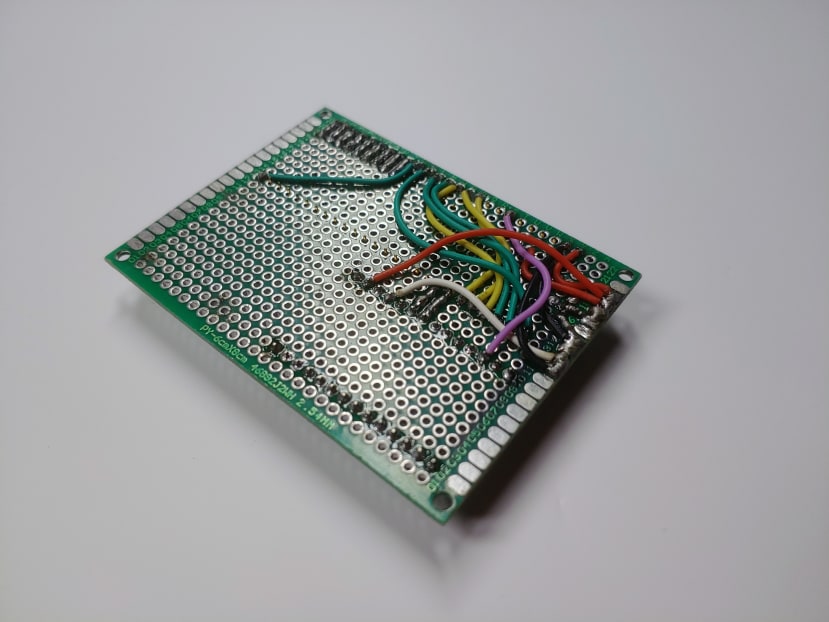
I usually use boards like this whenever there’s a lot of uncertainty surrounding how I plan to make my connections, I am quite used to making prototypes like this, so it works out “usually”, but I definitely don't recommend it, for one it's difficult to troubleshoot and it is especially not ideal for an application that features capacitive sensing, as it can introduce additional noise to the touch signals.
Schematic
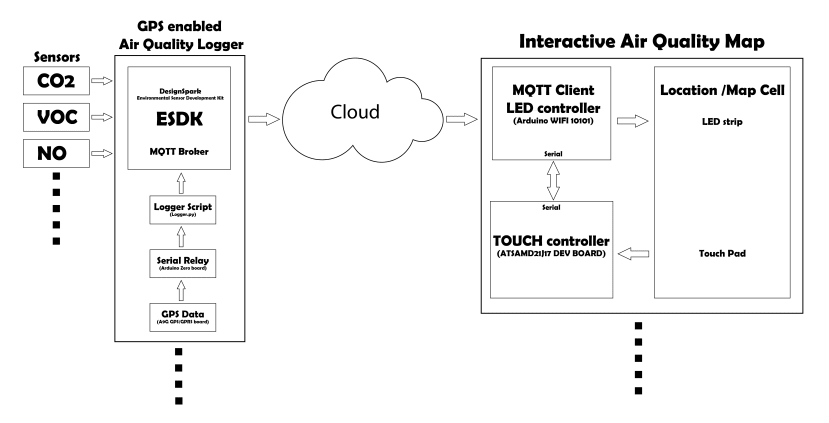
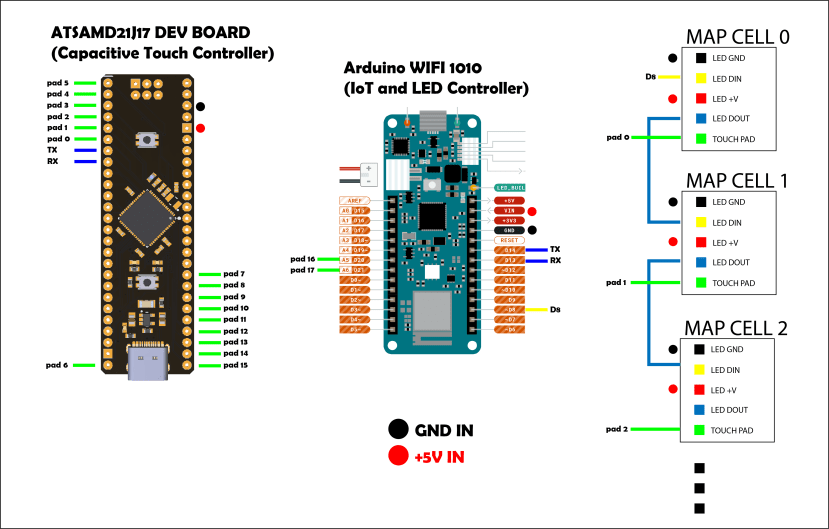
In addition to the custom PCB that controls most of the capacitive touch sensing on the map, I am also using an Arduino WIFI 1010 board, the Arduino board controls the addressable LEDs on the map and it also enables the IoT features of the map. The capacitive touch board connects to the Arduino through one of its serial ports, and the touch data sent is then combined with the air quality and GPS data from the ESDK and processed on the Arduino accordingly.
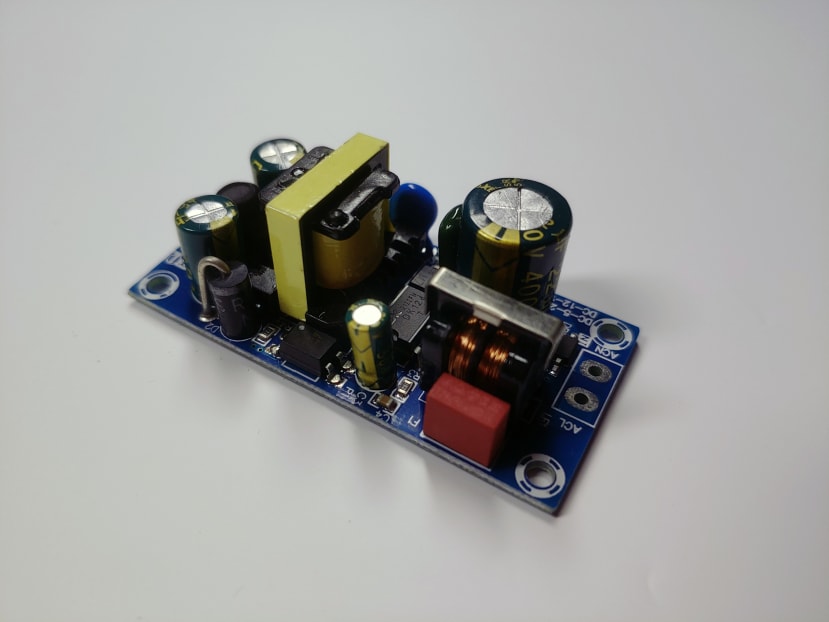
Power - The map is DC powered, but AC supplied using a 5V, 2.5A switching power supply.
Configuring and Calibrating Proximity on the Map
To develop the code and program the ATSAMD21J17 dev board (capacitive sensing controller), I am using MPLAB X IDE, which is the dedicated development environment for Microchip devices, Microchip also provides very helpful instructions on how to develop a capacitive touch application, instructions I followed and duplicated to setup detection on all the touchpads on the map. Although not as straightforward as with Arduinos, it wasn't too difficult to get the capacitive touch data streaming via serial, all the heavy lifting was done by the automatically generated code and I only had to modify a single function in the program and add a few lines of code to preprocess and format the data being sent to the Arduino.
I did have to calibrate the sensitivity and detection thresholds for all the areas on the map. I should also mention that the touch board doesn't actually handle all the touch detection on the map, the ATSAMD21J17 chip only has 16 channels for self-capacitance detection, and the map has 18 distinct areas, so I had to delegate the touch detection for the remaining two areas to the Arduino WIFI 1010 board, similar to what I did in part 1 of this project.
Getting Air Quality Data to the Map
We are now firmly in the programming section of this build, so, time for Tip 6 - “think what coding favours can i do for myself”, coming back to the map involving a lot of repetition, its important to code efficiently, the map has to react to multiple touch signals, store and organize different air quality data points (co2, VOC,…..) by the different areas that the data will be read from, so it's important to avoid specificity in the code as much as possible, we want less of if(area == “ikorodu”) and more of if(area == areas[index]).
struct
{
  String Area_Name = "";
  byte startindex = 0;
  byte endindex = 20;
  float Cap_Signal = 0;
  float prevCap_Signal = 0;
  float Cap_Threshold = genThreshold;
  float alpha = 1.0;
  float sensitivity = 0.0;
  long thresholdresettimer = 0;
  uint8_t detectionstate = 0;
  float sigSwing = 30.0;
  float maxsig = 0.0;
  float minsig = 99999.0;
  float sample[10];
  uint8_t samplecounter = 0;
  float rawsig = 0;
  long debounceTime = 0;
  int AIRQ_dataPT = 1500;
  int allDataPT[2];
} MAPCELL[19];
What I’ve done is implemented an array of structs for all the areas on the map; a class would work too, the struct contains variables like the area name, first and the last index of the LEDs illuminating that area, capacitive touch signal, and individually configured threshold values, it also holds variables for all the air quality data points provided by the ESDK. This allows me to reference all the per-area data on the map using a unique index which in turn makes programming a lot easier.
Showing Air Quality Levels
The primary way that the map shows the air quality levels is through the discrete colours shown on the areas on the map, but I understand that discrete colours alone probably won't communicate a lot, which is why I added the level bar you see to the left of the map. As the designer, I know what the colours represent, but the map is not built for me, it's built to inform the public of the air quality around them, the level bar provides the much-needed context to the map’s colour display. I should also add a small OLED screen to it at some point to display raw air quality levels.
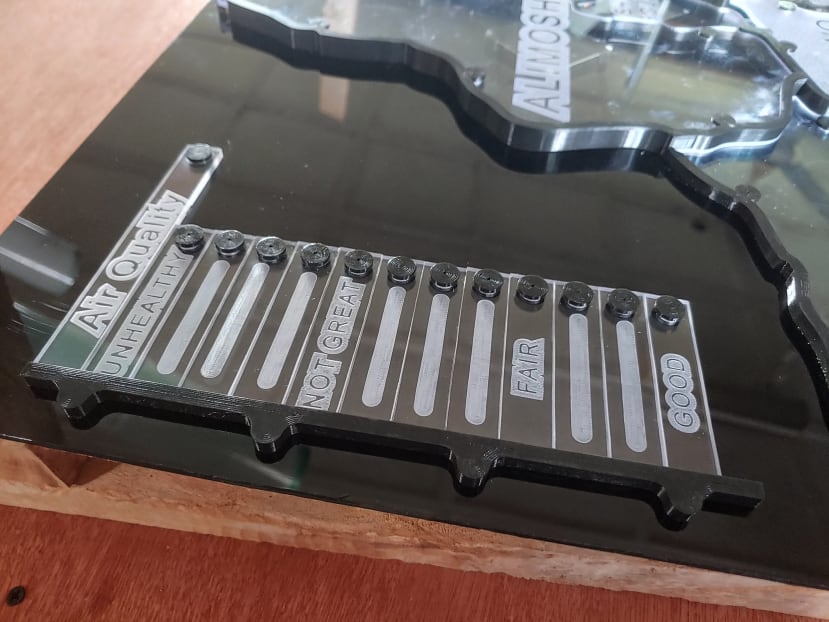
The bar has 12 levels that light up with colours within the blue to red colour range, I also named some levels on the bar using friendly, none aggressive words, I want to educate people not annoy them.
When a person walks up to the map and touches an area, the map detects the touch in that area and pulls up the current air quality data it has stored for it, it then calculates the equivalent level on a scale of 1 - 12, which tells it how many bars to light up on the level bar and what colour to use in lighting the touched area on the map.
Reverse Geocoding
Reverse geocoding is the process of converting latitude and longitude position data into an address that we can read and understand. I made the ESDK into a mobile air quality data logger in my second article, where I discussed my GPS hardware, implementation, and software, it's a good article for reference, here I’m building up on that and using the latitude and longitude data already being recorded on the logger to generate the address string that the map uses to find the location of the logger on the map.
How to Reverse Geocode
Google provides a reverse geocoding API that is perfect for this purpose, the full information about the API can be found here, but I'll summarize the steps required to get the data we need:
- Create a project on the google cloud console.
- Create a key for the project.
- Enable google’s geocoding API for the generated key.
- Substitute the key in the URL (https://maps.googleapis.com/maps/api/geocode/json?latlng=” Latitude here”,” Longitude here”&key=” API key here”) along with the latitude and longitude of the location you wish to reverse geocode.
- Paste the resulting URL into a web browser and you should see the JSON address for that location.
In Code - To get the address in code, we simply send a get request to the same URL, and then read the response as a JSON string. For the air quality map, we don't actually need all the information sent back from the API, all we need is the local government area name.
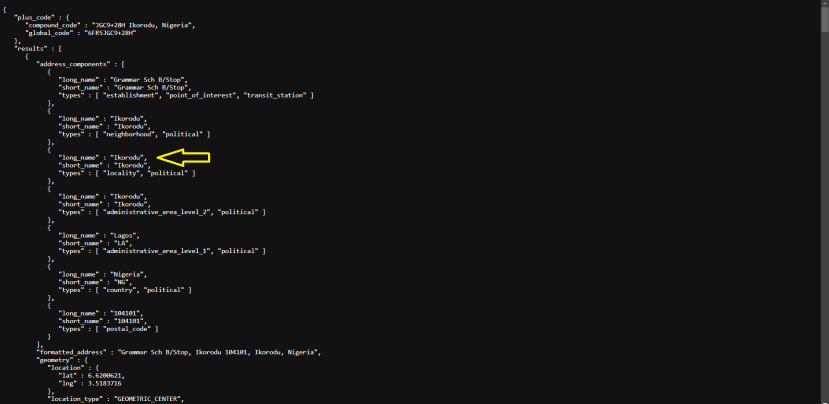
We need to navigate down the JSON string to get the required name, which is easy enough to do in python.
from unittest import result
import requests
apiquery = "https://maps.googleapis.com/maps/api/geocode/json?latlng=6.62007350384279,3.518361042330444&key=API KEY"
response = requests.get(apiquery)
data = response.json()
for i in data:
    if i == "results":
        try:
            print(data["results"][0]["address_components"][3]["long_name"])
            gotArea = data["results"][0]["address_components"][3]["long_name"]
        except:
            print("index error")
The code sends the API request, navigates through the JSON response, and prints out the local area name for the address.
Implementing this code on the logger allows me to append the area name to the recorded air quality data before publishing the string on the MQTT broker already running on the ESDK/ Logger, the string is published on a custom topic which I simply named “map”, publishing the appended data on a different topic allows me to set the air quality map to read only the data coming from the “map” topic. Once the data gets to the map, it's just a matter of extracting and sorting the data in the appropriate struct, based on the area that the data came from.
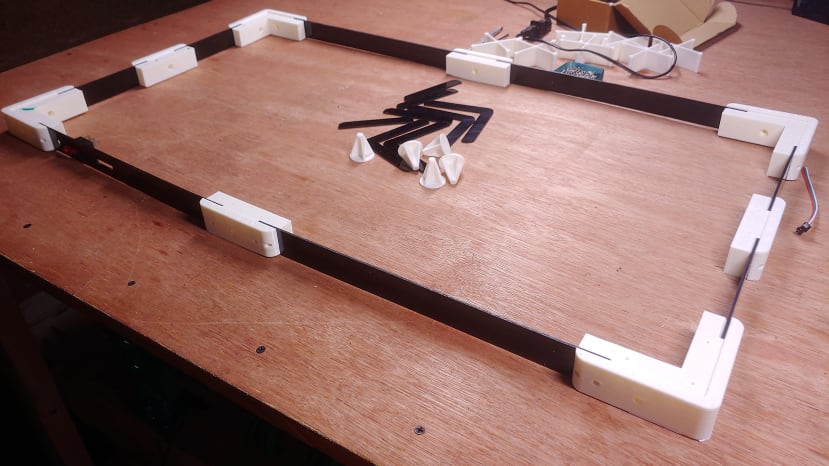
Framing The Map
This part of the build is open-ended, there are so many ways to frame something like this, I thought about using an off the shelve picture frame, and I considered making a custom frame out of wood and even metal, all valid options, but ultimately I decided to use a combination of 3d printed parts, CNC cut acrylic, with an aluminium composite board as the back panel for rigidity.
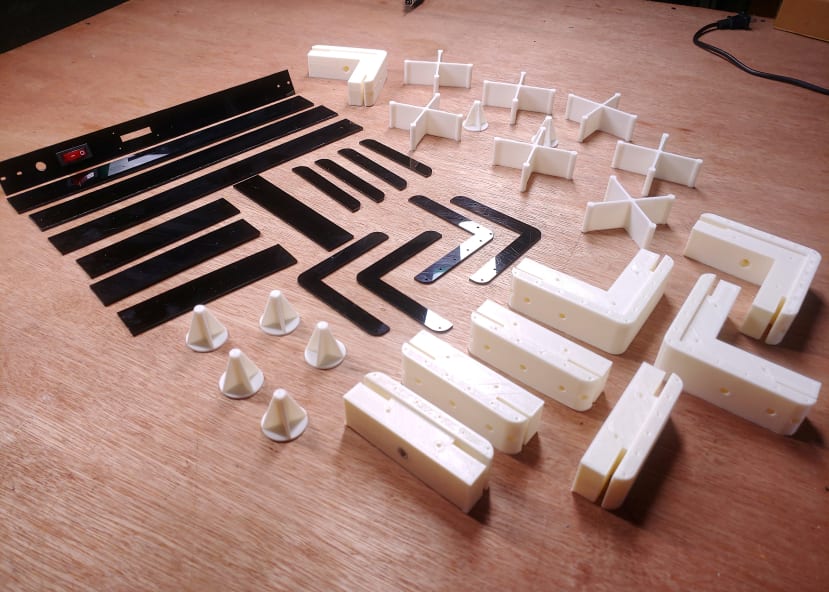
I generally favour breaking down the things I make into as small of a sub-assembly as possible, doing this helps with the ease of disassembly if I ever need to, and it especially helps me to circumvent the lack of constant electricity in Nigeria, so no long cutting jobs on the CNC and no time demanding 3D prints.
Inside the Map
Final Calibrations
After closing up the map I noticed that the characteristics of the capacitive touch pads had changed, they seemed noisier, likely caused by the switching power supply, and the large aluminium back panel. I had to recalibrate the pad thresholds in the map's completed state.
I tried to make the detection algorithm as robust and adaptive to noise as possible; it was a head-scratcher and I had to sacrifice a bit of sensitivity to deal with the noise, so if I am giving a seventh tip - it will be to use a coaxial cable for the capacitive touch pads, just to have grounding options against noise, you’ll find more information on capacitive touch shielding here. I anticipated the noise problem, which is why I designed a coplanar shield into the pads, I just didn't wire the ground for simplicity's sake.
If there are any unanswered questions relating to this map build, please refer to the repository for all the CAD and CODE I used, you can also leave a comment. also, make sure to follow the project to see the air quality map deployed in public.
Comments