River Level Monitoring with LoRaWAN and DesignSpark Metrics Part 1: Hardware, Network and Software
Follow article
 Dave from DesignSpark
How do you feel about this article? Help us to provide better content for you.
Dave from DesignSpark
Thank you! Your feedback has been received.
Dave from DesignSpark
There was a problem submitting your feedback, please try again later.
Dave from DesignSpark
What do you think of this article?
Recreating a river level monitoring solution with common off-the-shelf hardware and DesignSpark Metrics.

Introduction
In this project we’ll be reinstating a flood monitoring station utilising off-the-shelf LoRaWAN sensor hardware connected to The Things Network and publishing data to DesignSpark Metrics, to keep a watchful eye over the River Calder.
The Existing Solution
Previously, in 2016, a colleague had installed a monitoring sensor located outside our offices that provided data to the Flood Network — an initiative set up by Ben Ward initially to provide measurements to predict flooding within Oxford on a hyperlocal scale. Enough interest in the project was generated which resulted in sponsorship from Nominet UK (the domain name registrar that oversees UK domains) and the project took off on a greater scale.
LoRaWAN was used for communications and offered an excellent radio range. A number of these sensors were installed in the Calder Valley, by ourselves and Slow The Flow — a not-for-profit organisation specialising in natural flood management.
Unfortunately, the sensors that were originally deployed suffered from a shorter than expected battery life, requiring a change approximately every seven months, plus there were some hardware failures. However, the initial sensors did prove that the idea was valuable and encouraged us to recreate the system.
The New Solution
Instead of designing custom hardware which comes with all the challenges associated with battery powered operation, we settled upon an off-the-shelf ultrasonic distance sensor which should hopefully prove to be a more reliable solution.
Utilising The Things Network for communications makes deployment of sensors incredibly easy, in addition to the network having wide coverage plus good line-of-sight distance. The network is free to use and offers a number of APIs for data access, including but not limited to MQTT, webhooks, Node-RED and IFTTT (If This Then That).
For providing data logging and visualisation, we used DesignSpark Metrics with a Python script that connects to The Things Network MQTT broker for testing.
Hardware
The sensor we chose is the Dragino LDDS75-8 ultrasonic distance sensor. Featuring a flat object measuring range of 280-7500mm plus an 8.5Ah lithium primary cell battery, this sensor should cover most, if not all, river level monitoring use cases.

The ultrasonic transducer used by Dragino features a UART output and internal temperature compensation — a very important factor when taking distance measurements. Given the speed of sound in air is temperature dependent and varies by 0.17% per degree Celsius, the possibility of quite large measurement variations is possible. Pepperl+Fuchs has an interesting article that details a number of things that can affect the accuracy of ultrasonic measurements.
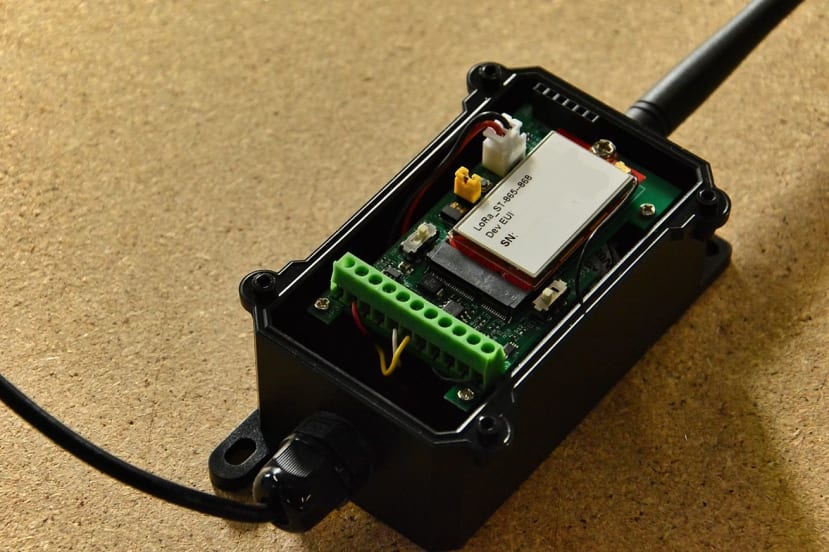
A compact IP66 rated enclosure keeps the rest of the electronics protected and dry. Inside, a lithium primary cell and supercapacitor combination provide power; a small, socketed LoRaWAN module provides the connectivity and a set of screw terminals provides access to a number of interfaces including RS485, UART, 1-wire and I2C.
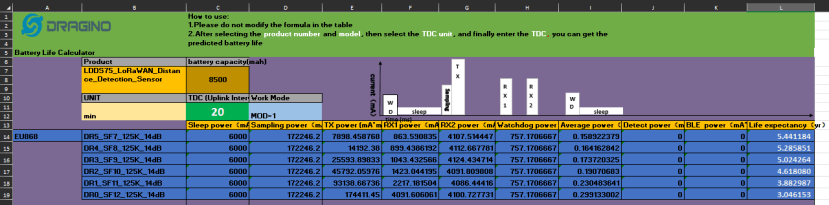
Dragino claims a battery life of up to ten years with the high capacity 8.5Ah battery, subject to network coverage, uplink interval and other factors that can be adjusted. An Excel-based calculator is provided that can be used to estimate a battery lifespan. With the default settings, the calculator estimates between three and five years of runtime on battery but this will likely change depending on environmental conditions — batteries tend to perform worse in colder climates.
Connecting to The Things Network
Provided in the box is a set of pre-programmed keys used for OTAA provisioning on a LoRaWAN network. This greatly simplifies the setup process and avoids having to connect to the control UART on the sensor — a step which would be necessary if the network did not support OTAA.

The first step is to login to the TTN console, then the application in question and register an end device. Provisioning options presented include scanning a QR code that contains all the necessary keys (unfortunately the QR code included on the label from Dragino only holds the device EUI), selecting a device from the repository or manually entering device specifics.
As the device was present in the repository, we selected this option. A number of prompts appear including firmware version, profile and frequency plan. As we’re in Europe the 863-870MHz frequency band is used. The field titled “JoinEUI” initially caused some confusion but upon hovering over the small question mark presented an explanation — in LoRaWAN versions prior to 1.1 this was called “AppEUI”.

Once populated another set of fields then appears, asking for “DevEUI” , “AppKey” and a human-readable end device ID. The glossary explains what each term means and links to other more in-depth documentation.
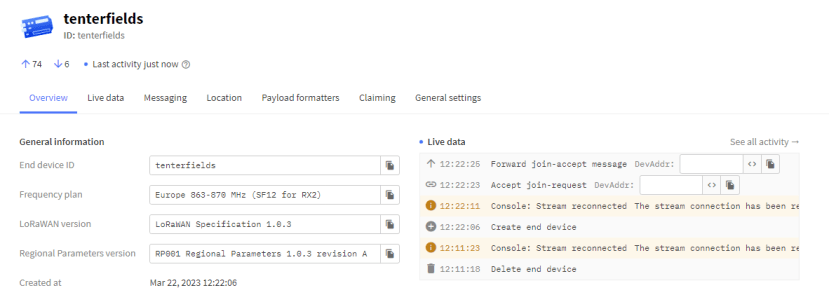
The sensor was then powered up and after a short while the live data console showed a successful join request with sensor data payloads received shortly afterwards.
Sensor data is received as a binary payload that contains the battery voltage, distance, interrupt status, a sensor flag and optional temperature value. Payloads can either be passed to another service as-is or decoded using a “payload formatter” — in this case Dragino has provided one written in JavaScript that is configured when the device was instantiated from the repository.

We modified the formatter slightly to only return numeric values instead of mixed text and numeric, opting to use -1 to indicate an error condition. The formatter changes were tested and then saved.

An MQTT client was then connected to the TTN broker to verify that our API key worked and the data was emitted in the expected format. The uplink data messages contain a lot of data points including information about the end device, received signal metadata and more.
Python Script
With data successfully being published to MQTT, we moved on to creating a Python script for testing that would push data to DesignSpark Metrics.

The script was based around our example DesignSpark Metrics MQTT bridge that would take a list of topics and push them to DSM. We modified this to subscribe to only one topic, extract a specific set of keys and publish these as metrics.
payload = json.loads(msg.payload)
print("Received message: {}".format(payload))

device_id = payload["end_device_ids"]["device_id"]
distanceMeasurement = payload["uplink_message"]["decoded_payload"]["Distance"]
rssiMeasurement = payload["uplink_message"]["rx_metadata"][0]["rssi"]
As the data comes in as a JSON object this needs to be converted into a Python dictionary for further use. This is done using the json.loads() function that then allows access to the items by name or position, in the case of an array. Values for distance and RSSI are extracted and published to DSM with one additional label of `deviceid` which is the friendly name of the sensor set in The Things Network.
Testing
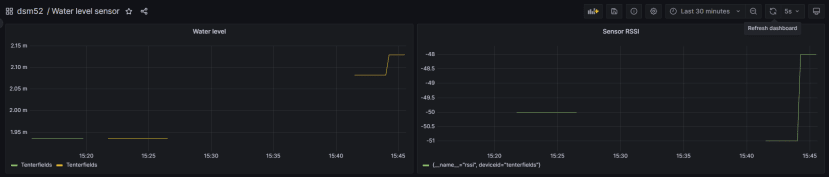
To test the sensor, a quick demonstration dashboard was put together in DesignSpark Metrics that has a graph of sensor distance and RSSI readings.

Due to the radiation pattern of the sensor and lack of suitably open space in our workshop, we could not gain an accurate measurement that would correlate with a tape measure due to reflections from items at the edge of the ultrasonic field. However, when pointing the sensor at objects at different distances we confirmed that the reading did change and correlate with the actual distance. The RSSI figure also varied as we moved around our workshop.
To provide readings more often than the configured interval for testing purposes the on-board reset button can be pressed which causes a reconnection and sensor reading to be transmitted. We could have sent a downlink message or used the UART to modify the interval, however this would need to be reverted before installation of the sensor.
In Conclusion
In this article, we’ve taken a look at how we plan on reinstating a flood monitoring station to replace an existing Flood Network sensor. We’ve cast an eye on what the Flood Network initiative was, the original hardware and the replacement COTS hardware from Dragino.
We’ve connected the sensor to The Things Network and then set up the MQTT integration to allow data export. A Python script was then written to bridge the MQTT broker into DesignSpark Metrics to allow for data logging and visualisation.
Part two of this series will be taking a look at site installation, sensor calibration to account for the height above the riverbed and building a more sophisticated dashboard.
Comments