PLCnext Can Crusher Upgrades: Proficloud
Follow article
 Dave from DesignSpark
How do you feel about this article? Help us to provide better content for you.
Dave from DesignSpark
Thank you! Your feedback has been received.
Dave from DesignSpark
There was a problem submitting your feedback, please try again later.
Dave from DesignSpark
What do you think of this article?
Integrating cloud metrics using the Proficloud Time Series Data Service.
Introduction
In this article we’ll be taking a look at Phoenix Contact’s Proficloud platform, running through the setup, and then enabling the time series data service to publish metrics about the Can Crusher operation to a web dashboard with alerts.
What is Proficloud?
Proficloud is an Industrial Internet of Things platform created by Phoenix Contact, marketed as a “plug and play” platform aimed at companies with limited or no IT resources. A number of “smart services” are offered, including solutions aimed at EV charging infrastructure management supporting a number of industry standards, device management to oversee Phoenix Contact smart devices, energy management including impulse analytics for mains surge protection, the time series data service (which is the focus of our article) and more.
Some services are still being developed, but most are available with either a free tier, or a low cost of under €40 per device per year. In particular, the Time Series Data Service offers a free tier positioned as a “test package” that is free and features up to twenty metrics published once per second, with alerting and data compression after one year. It is worth noting that multiple devices can be added to the free tier, but the twenty metrics are shared across all the devices.
The data compression, posting interval and alerting features are common across all tiers of the service — the only difference being the number of metrics allowed, where the maximum is 1500 in the “Premium” package.
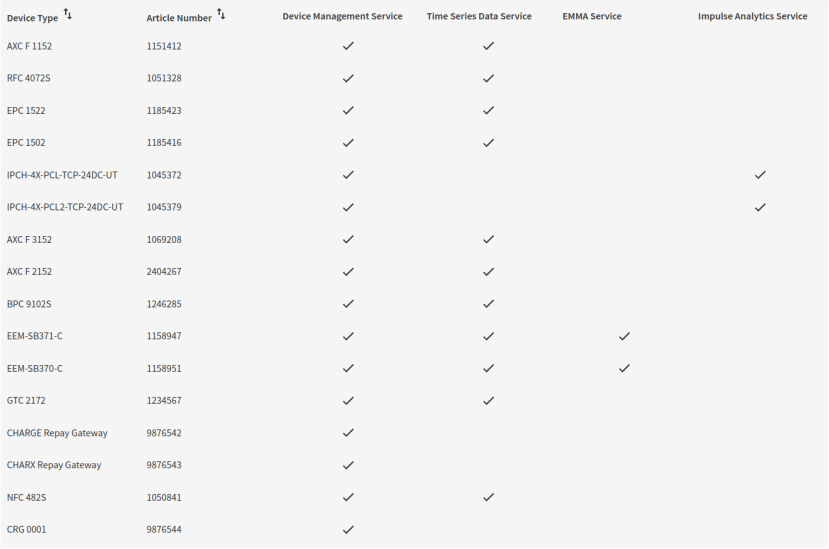
A number of Phoenix Contact devices are listed in the compatibility table, with support for third-party devices also provided through Node-RED with a number of custom libraries. These expose nodes that can be used to publish time series data, health status and logs.
Comprehensive eLearning courses have been produced that go through setup and connection of machines and devices to the Proficloud platform, including guides on usage of the services.
Getting Started with Proficloud

The “Getting Started” guide consists of five steps to get a device connected to Proficloud and publishing data.
First, an account needs to be created. This is perhaps the easiest step, as would be expected.

With the account verified and signed in, we are immediately greeted with the “Device Management Service” interface with a large blue “Add device” button calling out to be clicked. The only information required to add a device is the UUID found printed on the enclosure. In our case with an AXC F 2152 controller, this is located on the lower right-hand side panel and necessitated removal from the DIN rail. After doing this, we discovered the device UUID is also available on the WBM in the “Proficloud Services” section.

As the PLC needs the Proficloud service to be enabled, the DMS shows the device as being offline. The Proficloud services are enabled through the web-based management by ticking the “Enable Connection” and “Time Series Data” checkboxes.
Registration status then changed to online in both the PLC WBM and Proficloud. From within the Device Management Suite remote firmware updates can be performed, the running application can be updated and logs can be viewed.
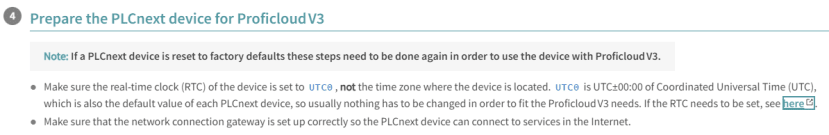
Before we published any metrics, the PLC time had to be changed to align with UTC+0, due to the way that time zones are handled internally. This was easily done with PLCnext Engineer, requiring only a reboot to effect the change.
Publishing Metrics to Proficloud
With the PLC successfully connected, we moved on to publishing metrics to the cloud platform.
Most PLCnext Engineer data types can be published to Proficloud with only the tick of a checkbox required. It is worth noting however that all users within a Proficloud organisation can see transmitted variable values from any device.

Due to the way we initially structured our PLC programme, some additional variables were created to store values that would be published to the cloud. Any variable to be published must be set as an “OUT Port” usage type and the Proficloud check box ticked.
A small ST code file was then written that would update the “cloud” variables from the normal program variables.

After downloading the updated PLC program and waiting some time, metrics appeared that could be assigned to the Proficloud device. We selected the four that were created then moved over to the dashboard.
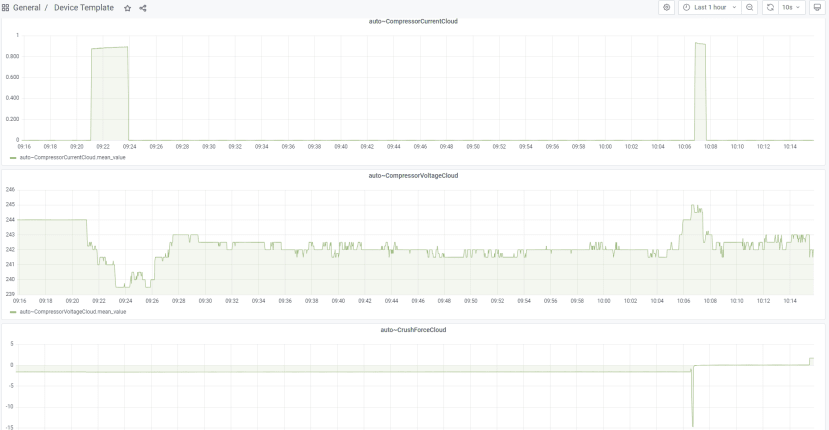
The “Device Template” dashboard was then opened. This auto-populates with all the metrics assigned to a device once a UUID has been selected; we observed that our four variables appeared with readings.

A simple dashboard was then built that would display compressor current and voltage, system pressure and the crush force exerted on the can. A “stat” visualisation was used for the pressure and crush force; this combines a graph with a large numeric display of the reading.

Alerting is also easily set up from within the Proficloud TSD web interface. We opted to test setting up an email notification channel which was as easy as inputting an email address (or addresses) that the alerts should be sent to, then clicking save. Other notification channels are available, including Microsoft Teams, Pushover, Slack, webhooks and more.

The alerts themselves are then set up from within any dashboard graph panel, meaning duplicate queries do not have to be created just for the purposes of alerting. For our example alert, the rule is evaluated every one minute for two minutes — this means that the state will change to “pending” providing the conditions are met — then if the conditions carry on for more than two minutes an alert will be generated.
The condition was set so that the average compressor current must be above four amps for the last five minutes to then generate the alert, which will send an email announcing that the current is high. Multiple conditions can also be set that trigger the rule based on different criteria.
To Finish
In this article we’ve taken a look at the Proficloud IIoT cloud platform that offers a number of services aimed at industrial customers, and which also has the added benefit of being suitable for those with either no or small IT departments.
We’ve explored the various services available and what they offer, as well as setting up the Proficloud connection on a PLCnext controller, as well as modifying the program to publish variables. The thorough getting started guide makes this process a breeze. We also explored building a dashboard for our can crusher and setting up an email alert based on the compressor current being too high.
Comments