Home monitor with Rock 4C+: Part 2 - Connecting the dots
Follow article Dave from DesignSpark
How do you feel about this article? Help us to provide better content for you.
Dave from DesignSpark
Thank you! Your feedback has been received.
Dave from DesignSpark
There was a problem submitting your feedback, please try again later.
Dave from DesignSpark
What do you think of this article?
In the first part of the home automation series we have seen how to prepare the Rock 4C+ (230-6199) by installing Ubuntu server as operating system, having the system run from an external, faster hard-disk, and installing Mosquitto and Node-RED as application software.
In this part of the home automation series, we will start using this software. The goal is to understand how information flows through the system and how we can process it to suit our needs. Of course, a brief knowledge of Mosquitto and Node-RED is necessary, but if you never heard of them now it's a good time to start looking into these technologies as they are widely used in the world of IoT (there are plenty of videos and articles on the Internet to help you start). But if you are comfortable with these two technologies you can jump directly to the third part of the series where we will describe a real system built around Rock 4C+.
Step 1 - Get some data
To test our setup and get a basic idea of what we can do using MQTT and Node-RED we will need some data produced by a device of some sort. In my setup I use a tiny microcontroller called ESP8266 - it can be flashed with a program, has a few input-output pins that can be programmed and connected to sensors to read data, and also has WiFi capabilities to connect to a server on TCP/IP.
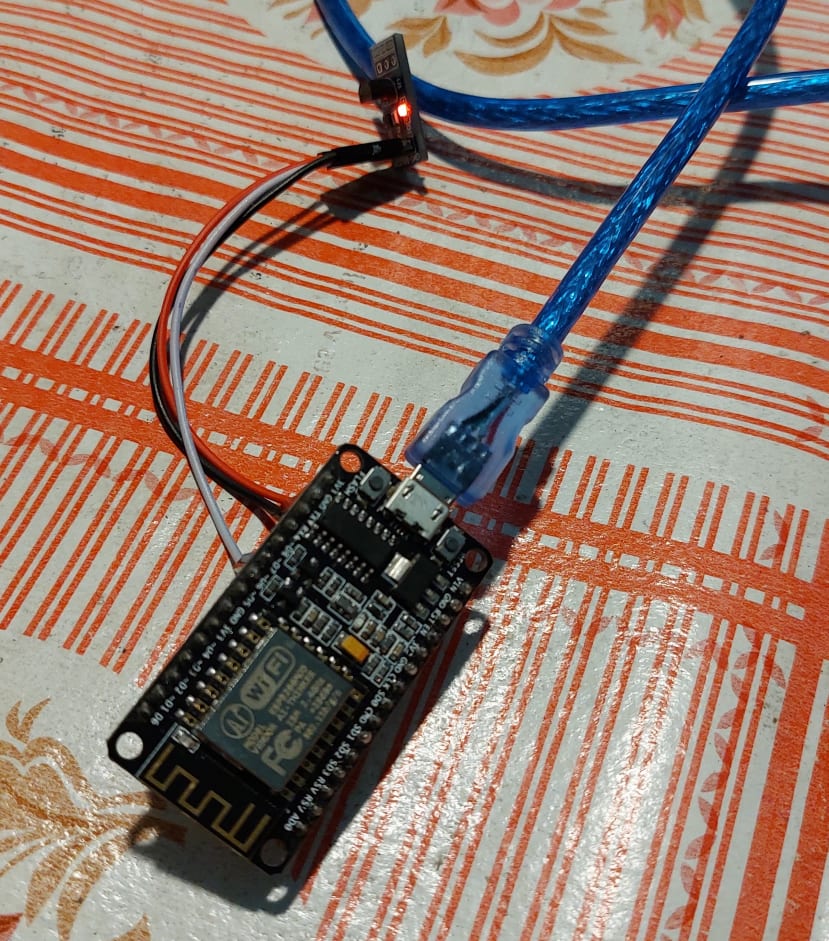
There is a lot of literature about programming ESP8266. You can write your own program in Arduino IDE and upload it to the ESP, or you can use other programs such as ESPEasy, Tasmota or ESPHome, or even high-level interpreters such as LUA. We will not go here into all these details, but we will use an ESP8266 board (on the bottom of the picture) flashed with Tasmota and that is connected to a Dallas DS18B20 temperature sensor (the transistor-lookalike on the tiny board on the top that has a red LED confirming it receives power):
Tasmota is configured to connect the temperature sensor and to periodically read the temperature and send it to the MQTT server we have previously set up. It will also send to the MQTT server some status information about itself, and all this data is sent by text formatted as JSON messages; below is the Tasmota console showing these messages:

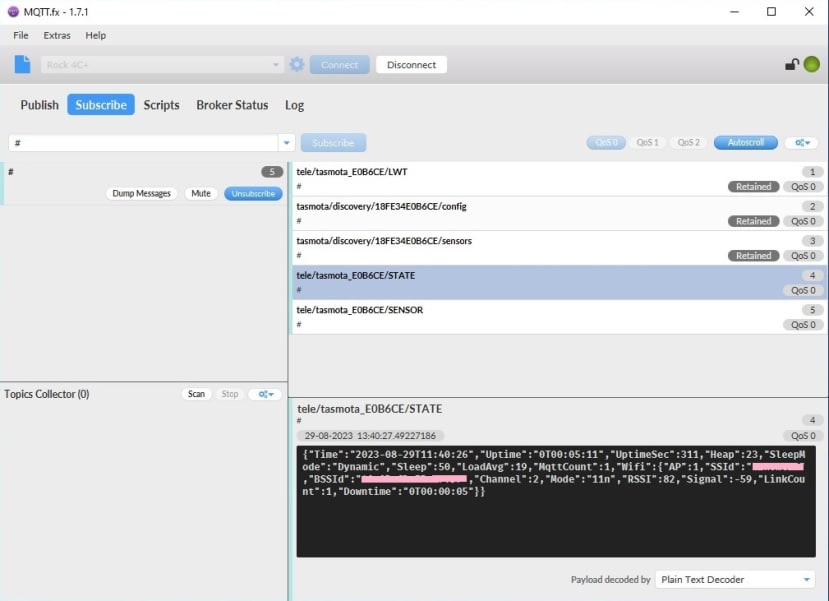
Messages have associated a topic (tele/tasmota_E0B6CE/SENSOR for the temperature information, the same with STATE for status info about the device) and the data (enclosed in {} and formatted as a series of key:value pairs).
To verify what messages have reached our Mosquitto server installed on the Rock 4C+ we can use an MQTT client - such as MQTT.fx on Windows:
Step 2 - Process data
For that we have installed Node-RED: it can accept a visually-designed flow that transfer information (it is called messages) between different nodes, and each node does some kind of processing on the messages it receives. Node-RED has a large palette of built-in nodes that can be extended as needed, and those nodes can do things like getting a message from an MQTT server, simple transformations on the message, filter messages or write your own function in JavaScript to process the messages. There are also nodes that can display information in a webpage (charts, gauges or simple text).
By the way, this last kind of nodes need to be installed manually, as they are part of a nodes collection called dashboard:

They will be added to the palette in the left and can be further dragged on the working area as any other node (they will need further configuration to define on which webpage will appear, and how they are grouped together in logical groups):

To test all our work previously done we will implement a simple flow that does the following (we use a variety of nodes of whom some are unnecessary and/ or not optimized, just to show the richness of features in Node-RED):
- connects to MQTT server as a subscriber and gets all messages sent with the topic "tele/tasmota_E0B6CE/" - they are coming from our temperature sensor as temperature values and status data
- One path will select messages about the temperature, will create a JSON object from the message and we will use a function to extract only the temperature value from the object and push it to be displayed by a gauge and in a chart
- The second path does about the same on the status messages to extract uptime of our ESP8266 unit and display it as plain text
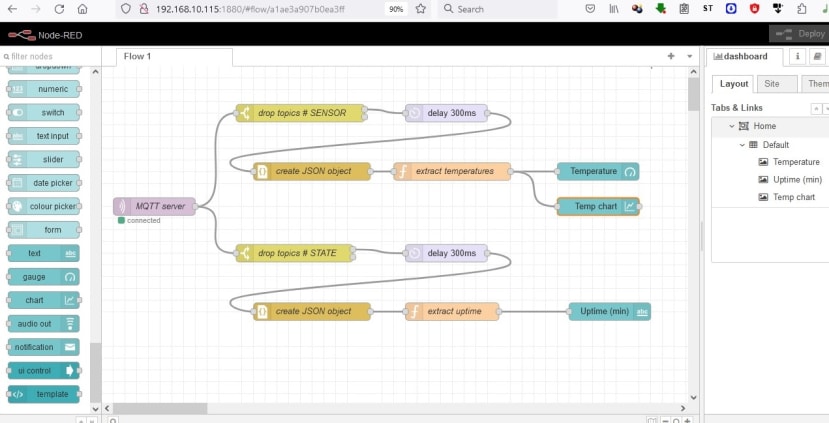
The result of all this work is a page like this:

If you want to play with the above flow, just copy/ paste it into the import feature of Node-RED:
[

{

"id": "584a01f2837207c9",

"type": "mqtt in",

"z": "a1ae3a907b0ea3ff",

"name": "MQTT server",

"topic": "tele/tasmota_E0B6CE/#",

"qos": "2",

"datatype": "auto",

"broker": "8561cfd2.7506e",

"nl": false,

"rap": false,

"inputs": 0,

"x": 90,

"y": 240,

"wires": [

[

"30a7f86cdcc7c014",

"981f215a867916f6"

]

]

},

{

"id": "30a7f86cdcc7c014",

"type": "switch",

"z": "a1ae3a907b0ea3ff",

"name": "drop topics # SENSOR",

"property": "topic",

"propertyType": "msg",

"rules": [

{

"t": "eq",

"v": "tele/tasmota_E0B6CE/SENSOR",

"vt": "str"

},

{

"t": "neq",

"v": "tele/tasmota_E0B6CE/SENSOR",

"vt": "str"

}

],

"checkall": "true",

"repair": false,

"outputs": 2,

"x": 340,

"y": 80,

"wires": [

[

"950fdcfb9b9105dc"

],

[]

]

},

{

"id": "950fdcfb9b9105dc",

"type": "delay",

"z": "a1ae3a907b0ea3ff",

"name": "",

"pauseType": "delay",

"timeout": "300",

"timeoutUnits": "milliseconds",

"rate": "1",

"nbRateUnits": "1",

"rateUnits": "second",

"randomFirst": "1",

"randomLast": "5",

"randomUnits": "seconds",

"drop": false,

"outputs": 1,

"x": 590,

"y": 80,

"wires": [

[

"fea899aaf45bf054"

]

]

},

{

"id": "fea899aaf45bf054",

"type": "json",

"z": "a1ae3a907b0ea3ff",

"name": "create JSON object",

"property": "payload",

"action": "",

"pretty": false,

"x": 360,

"y": 180,

"wires": [

[

"3ca4f59deb10d6f3"

]

]

},

{

"id": "3ca4f59deb10d6f3",

"type": "function",

"z": "a1ae3a907b0ea3ff",

"name": "extract temperatures",

"func": "return({payload:msg.payload[\"DS18B20\"].Temperature});\n",

"outputs": 1,

"noerr": 0,

"initialize": "",

"finalize": "",

"libs": [],

"x": 600,

"y": 180,

"wires": [

[

"20dc6a55188d05ac",

"a6a92b4bc0bdab2e"

]

]

},

{

"id": "981f215a867916f6",

"type": "switch",

"z": "a1ae3a907b0ea3ff",

"name": "drop topics # STATE",

"property": "topic",

"propertyType": "msg",

"rules": [

{

"t": "eq",

"v": "tele/tasmota_E0B6CE/STATE",

"vt": "str"

},

{

"t": "neq",

"v": "tele/tasmota_E0B6CE/STATE",

"vt": "str"

}

],

"checkall": "true",

"repair": false,

"outputs": 2,

"x": 330,

"y": 320,

"wires": [

[

"a7be14792e47a2af"

],

[]

]

},

{

"id": "a7be14792e47a2af",

"type": "delay",

"z": "a1ae3a907b0ea3ff",

"name": "",

"pauseType": "delay",

"timeout": "300",

"timeoutUnits": "milliseconds",

"rate": "1",

"nbRateUnits": "1",

"rateUnits": "second",

"randomFirst": "1",

"randomLast": "5",

"randomUnits": "seconds",

"drop": false,

"outputs": 1,

"x": 590,

"y": 320,

"wires": [

[

"abb9f09f7e24d8f6"

]

]

},

{

"id": "abb9f09f7e24d8f6",

"type": "json",

"z": "a1ae3a907b0ea3ff",

"name": "create JSON object",

"property": "payload",

"action": "",

"pretty": false,

"x": 360,

"y": 420,

"wires": [

[

"92b6e6b44d6df3de"

]

]

},

{

"id": "92b6e6b44d6df3de",

"type": "function",

"z": "a1ae3a907b0ea3ff",

"name": "extract uptime",

"func": "return ({ payload: Math.trunc(msg.payload.UptimeSec / 60)});",

"outputs": 1,

"noerr": 0,

"initialize": "",

"finalize": "",

"libs": [],

"x": 600,

"y": 420,

"wires": [

[

"8d74cae9d8bf7655"

]

]

},

{

"id": "20dc6a55188d05ac",

"type": "ui_gauge",

"z": "a1ae3a907b0ea3ff",

"name": "",

"group": "35bd69e27eb78dab",

"order": 1,

"width": 0,

"height": 0,

"gtype": "gage",

"title": "Temperature",

"label": "units",

"format": "{{value}}",

"min": 0,

"max": "100",

"colors": [

"#00b500",

"#e6e600",

"#ca3838"

],

"seg1": "",

"seg2": "",

"diff": false,

"className": "",

"x": 850,

"y": 180,

"wires": []

},

{

"id": "8d74cae9d8bf7655",

"type": "ui_text",

"z": "a1ae3a907b0ea3ff",

"group": "35bd69e27eb78dab",

"order": 2,

"width": 0,

"height": 0,

"name": "",

"label": "Uptime (min)",

"format": "{{msg.payload}}",

"layout": "row-spread",

"className": "",

"style": false,

"font": "",

"fontSize": 16,

"color": "#000000",

"x": 870,

"y": 420,

"wires": []

},

{

"id": "a6a92b4bc0bdab2e",

"type": "ui_chart",

"z": "a1ae3a907b0ea3ff",

"name": "",

"group": "35bd69e27eb78dab",

"order": 2,

"width": 0,

"height": 0,

"label": "TempChart",

"chartType": "line",

"legend": "false",

"xformat": "HH:mm:ss",

"interpolate": "linear",

"nodata": "",

"dot": false,

"ymin": "",

"ymax": "",

"removeOlder": 1,

"removeOlderPoints": "",

"removeOlderUnit": "3600",

"cutout": 0,

"useOneColor": false,

"useUTC": false,

"colors": [

"#1f77b4",

"#aec7e8",

"#ff7f0e",

"#2ca02c",

"#98df8a",

"#d62728",

"#ff9896",

"#9467bd",

"#c5b0d5"

],

"outputs": 1,

"useDifferentColor": false,

"className": "",

"x": 850,

"y": 240,

"wires": [

[]

]

},

{

"id": "8561cfd2.7506e",

"type": "mqtt-broker",

"name": "MQTT server",

"broker": "192.168.10.115",

"port": "1883",

"clientid": "",

"autoConnect": true,

"usetls": false,

"compatmode": false,

"protocolVersion": "4",

"keepalive": "60",

"cleansession": true,

"birthTopic": "",

"birthQos": "0",

"birthPayload": "",

"birthMsg": {},

"closeTopic": "",

"closeQos": "0",

"closePayload": "",

"closeMsg": {},

"willTopic": "",

"willQos": "0",

"willPayload": "",

"willMsg": {},

"userProps": "",

"sessionExpiry": ""

},

{

"id": "35bd69e27eb78dab",

"type": "ui_group",

"name": "Default",

"tab": "aa18c08484eb4431",

"order": 1,

"disp": true,

"width": "6",

"collapse": false,

"className": ""

},

{

"id": "aa18c08484eb4431",

"type": "ui_tab",

"name": "Home",

"icon": "dashboard",

"disabled": false,

"hidden": false

}

]
In the last part of this series on home automation we will see the real thing: a more complex system that collects and displays information about:
- a small solar system that charges during the day and lights the entrance of my house
- It collects also temperature and humidity data from outside
- a sensor on my heating unit (I burn wood to heat the house or to make hot water)
- a sensor in one of the rooms for temperature and humidity data from inside
- some bell and whistles such as: weather forecast, speed tests if my Internet connection or the status of the cartridges in my laser printer (all these are just add-ons that does not involve sensors or processing by the home monitor system)