Cloud-enabling an RS Pro Electronic Load for Battery Capacity Measurement
Follow articleHow do you feel about this article? Help us to provide better content for you.
Thank you! Your feedback has been received.
There was a problem submitting your feedback, please try again later.
What do you think of this article?
Creating a Python script to control an RS Pro electronic load and publish metrics to DesignSpark Cloud.
Introduction
As we have a number of large sealed lead-acid batteries that are all in an unknown condition, we wanted a way to carry out capacity measurement to inform our decision on whether to purchase new batteries.
We’ve previously taken a look at the RS Pro KEL-103 electronic load (180-8788) and we discovered that this features a battery test mode which is perfectly suited to this application. The load provides the ability to set a constant discharge current that will terminate based upon reaching a set discharge capacity, low voltage cut off or a timer expiring. We also set out to connect the instrument to DesignSpark Cloud to allow for remote logging, data sharing and monitoring.
Initial Investigation
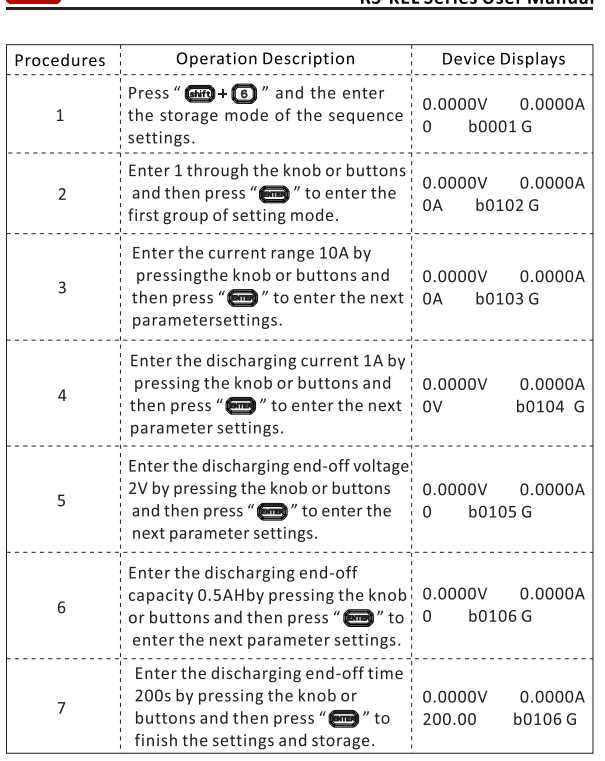
Rather than aimlessly pressing buttons to figure out how to program appropriate battery test settings, we started out by reading the user manual. Having a clear user manual greatly reduces the barrier to entry when getting started using a new piece of equipment, and the manual for the RS-KEL103 load does just that.
The user manual details how to configure a battery test regime which worked, but would only allow for local monitoring and control from the instrument front panel.
Using the GUI application to program and monitor the electronic load was far easier. We checked that settings were applied as expected, and then enabled logging so that the data produced was saved. Local logging is perfectly adequate if only one person at a fixed location needs to be able to access test data. However, this comes with all the usual pitfalls including making backups, sharing data with others, presenting the data in an easy-to-understand format and performing analysis.
Cloud Integration
Pushing the data to DesignSpark Cloud means that we can easily do all of the aforementioned. For example, visualising data is easier as a dashboard needs to be created only once and, thanks to the use of variables, supports displaying multiple different sets of data. A more traditional way of doing this would be to open a CSV file in a spreadsheet tool, produce a number of plots and then save these, which would need to be done for each individual dataset.
Sharing data is easier when stored in the cloud, as opposed to having to deal with emailing or sharing files. The same data can also be represented in different ways by using different dashboards. For example, a maintenance supervisor might want to see an overall view of battery health across a fleet of batteries, whereas an engineer could want a more in-depth look at the state of each battery including discharge curves at multiple currents, all overlaid onto the same graph.
Access to data in real-time is also another reason why we wanted to push our data to DesignSpark Cloud. Rather than having to wait potentially up to twenty hours for a full discharge cycle to complete, a picture of overall battery health can be built up as the cycle progresses by observing the discharge curve on a graph. This meant we felt comfortable leaving the test setup running overnight, relying on remote observation to ensure nothing was going awry.
Remembering that the instrument supported SCPI commands, we started to investigate this as a route to allow configuration and data logging.
Using The SCPI Interface
The SCPI (Standard Commands for Programmable Instruments) interface defines a standard syntax and command set for controlling programmable test and measurement devices. The SCPI command set defines plaintext strings that can be sent over physical layers such as serial, Ethernet, USB and IEEE-488 (GPIB).
A number of different instrument classes are defined within the SCPI specification, which allows for replacement of devices whilst retaining at least some level of compatibility. For example, a controllable power supply would implement the “DCPSUPPLY” class, possibly with instrument-specific extensions on top.
The electronic load supports SCPI commands delivered over either RS232 or Ethernet. We opted to try to use the Ethernet interface first, as this would allow us to control the instrument from any machine in our office. To handle communications PyVISA was pressed into service — this provides a Python interface into a number of VISA backends (which expose a standard API for test and measurement control) that communicate with the instruments.
Unfortunately, PyVISA does not support sending commands over a UDP connection, which is the only transport that the electronic load supports. This was discovered after trying a number of different connection strings that attempted to set up a TCP connection.
At this point, we could have written our own library to use a UDP socket for communication with the instrument, but this would’ve taken too much time and could have created additional scope for error, where if we experienced problems it could be our library at fault or simply sending the wrong commands.
Finally, we settled on using the time-tested RS232 connection that generally just works. PyVISA supports RS232 connections that are local to the host machine, or ones presented by a serial device server over a network connection.
Writing the Python Script
To bundle all the commands up in a reusable way we decided to write a Python script that takes a number of arguments to configure the instrument, and also logs data every minute.
parser.add_argument('-d', '--device', type=str, help="PyVISA device string") # PyVISA device string
parser.add_argument('-b', '--baud', type=int, help="PyVISA device baud rate")
parser.add_argument('-c', '--capacity', type=int, help="The battery capacity in Ah")
parser.add_argument('-a', '--amperage', type=float, help="The battery discharge rate in A")
parser.add_argument('-v', '--voltage', type=float, help="The battery cutoff voltage")
parser.add_argument('-t', '--time', type=int, help="Discharge cutoff time in minutes")
parser.add_argument('-i', '--instance', type=str, help="DesignSpark Metrics instance")
parser.add_argument('-u', '--url', type=str, help="DesignSpark Metrics URL")
parser.add_argument('-k', '--key', type=str, help="DesignSpark Metrics key")
parser.add_argument('-n', '--name', type=str, help="Battery name for label on dashboard", default="battery")

args = parser.parse_args()

try:
	rm = pyvisa.ResourceManager('@py')
	load = rm.open_resource(args.device)
	load.baud_rate = args.baud
	device_idn = load.query('*IDN?')
	logging.info("Device identifier: {}".format(device_idn[:-1]))
except Exception as e:
	logging.error("Could not establish device connection, reason {}".format(e))
	exit()
Initial steps taken by the script consist of parsing all ten command line arguments and then setting up a resource manager, opening the VISA device and then querying the device identity with the command “*IDN?”. The result of the identification query is printed to the console and contains the device name, firmware version and serial number.
try:
	m = Metrics.Metric(instance=args.instance, key=args.key, url=args.url)
except Exception as e:
	logging.error("Could not start DesignSpark Metrics, reason {}".format(e))
For data logging the script posts metrics up to DesignSpark Cloud, utilising the new DesignSpark.Cloud Python module. This provides an easy-to-use interface for writing metrics and some additional helper functions for reading metrics. An instance of the Metrics submodule is created ready for use later on in the script.
try:
	batt_string = f":BATT 1,{args.amperage + 3}A,{args.amperage}A,{args.voltage}V,{args.capacity}AH,{args.time}M"
	logging.info("Setting battery mode to {}".format(batt_string))
	load.write(batt_string)
	time.sleep(1)
	load.write(':RCL:BATT 1')
	time.sleep(1)
	logging.info("Turning on input")
	load.write(':INP ON')
except Exception as e:
	logging.error("Failed configuring and enabling instrument, reason {}".format(e))
The battery test mode configuration is as easy as sending a comma-separated string that starts with “:BATT” and contains a memory number (in our case we fix this at one), maximum current, discharge current, cut-off voltage, cut-off capacity and cut-off time in minutes. A string is built containing all these data points, written to the instrument, recalled from memory slot one and the input turned on which starts the discharge cycle.
while load.query(':INP?') == 'ON\n':
	capacity_list = []
	voltage_list = []
	current_list = []
	for x in range(60):
		if load.query(':INP?') == 'ON\n':
			batt_capacity = float(load.query(':BATT:CAP?')[:-3])
			capacity_list.append(batt_capacity)
			batt_time = float(load.query(':BATT:TIM?')[:-2])
			batt_voltage = round(float(load.query(':MEAS:VOLT?')[:-2]), 2)
			voltage_list.append(batt_voltage)
			batt_current = round(float(load.query(':MEAS:CURR?')[:-2]), 2)
			current_list.append(batt_current)

			batt_mins = int((batt_time * 60) % 60)
			batt_secs = int((batt_time * 3600) % 60)
			logging.info("Capacity: {}Ah, voltage: {}, current: {}, time: {}:{}".format(batt_capacity, batt_voltage, batt_current, batt_mins, batt_secs))
			time.sleep(1)
		else:
			break
A while loop then executes as long as the input is turned on — when the discharge cycle is completed the instrument automatically turns the input off. Within the while loop a for loop is iterated over once a second, polling the instrument for consumed capacity, input voltage and input current. Each reading is added to a list for later use and additionally printed to the console output.
# Publish metrics every minute
if load.query(':INP?') == 'ON\n':
	capacity = sum(capacity_list) / len(capacity_list)
	status = m.write({"name":"batt_capacity", "value":capacity, "battery_name":args.name})
	if status:
		logging.info("Successfully published capacity to Prometheus")
	else:
		logging.error("Error publishing! Reason {}".format(status))

	voltage = sum(voltage_list) / len(voltage_list)
	status = m.write({"name":"batt_voltage", "value":voltage, "battery_name":args.name})
	if status:
		logging.info("Successfully published voltage to Prometheus")
	else:
		logging.error("Error publishing! Reason {}".format(status))

	current = sum(current_list) / len(current_list)
	status = m.write({"name":"batt_current", "value":current, "battery_name":args.name})
	if status:
		logging.info("Successfully published current to Prometheus")
	else:
		logging.error("Error publishing! Reason {}".format(status))
After the for loop has finished another if statement checks the input is still turned on, then proceeds to calculate an average for each of the lists mentioned above. This average value is the figure published to DesignSpark Metrics and includes a label called “battery_name” that holds a user-supplied value from the “-n” command line switch.
Writing metrics to the cloud utilising the DesignSpark.Cloud module is as easy as calling the “write” function, which accepts a dictionary containing at the bare minimum a “name” and “value” key. The name is a string containing only alphanumeric characters and an underscore; and the value can be either a float or an integer value. Additional labels are supplied as key-value pairs where the key becomes the label name.
Documentation is available for the library on DesignSpark Docs and sources are available on GitHub.
With the discharge cycle completed, a final set of values are published to DesignSpark Metrics, which includes a last capacity measurement and run time in minutes.
Building a Dashboard
A simple dashboard consisting of a combined battery voltage and capacity graph, a battery capacity and discharge current statistic was created in Grafana.
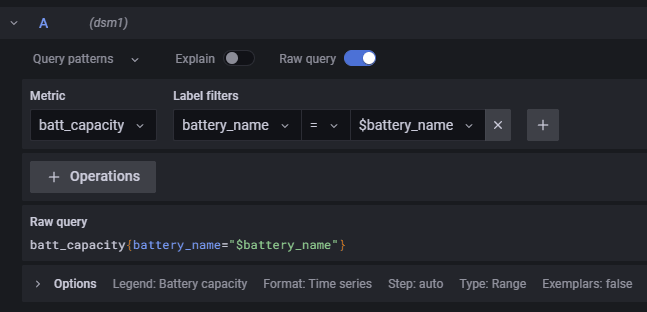
To be able to select between different battery names a variable was created that executes a Prometheus query to retrieve all the available values for the “battery_name” label.
This variable is then available for use by any item on the dashboard, in our case it is used to filter the “battery_name” label across all the panels.
To Finish
This project has taken a look at configuring the RS Pro electronic load (180-8788) for battery capacity measurements, using both the provided Windows GUI tool and a custom Python script. We’ve also taken a dive into the script to explore how it works and the integration with the DesignSpark Metrics platform for data logging.


