You Probably Need a Battery Emulator. No, Really….
Follow article
 Dave from DesignSpark
How do you feel about this article? Help us to provide better content for you.
Dave from DesignSpark
Thank you! Your feedback has been received.
Dave from DesignSpark
There was a problem submitting your feedback, please try again later.
Dave from DesignSpark
What do you think of this article?
Batteries. For most people, they’re simply those things you run out of on Christmas morning when the kids rush to power up the new toys Santa just delivered. But at the more serious end of the electronics industry, batteries are the lifeblood of mobile applications and remote infrastructure.
Ultra-low power devices that can hibernate between short activity cycles, coupled with improved battery technologies, have enable near-miraculous increases in application up-time before a battery needs charging or replacing – often stretching from many months into years.
For contrast, if you’re old enough to have had an analogue cell phone (circa the mid-90’s), you may fondly remember that you were lucky to get eight hours stand-by on a full charge. That was doing nothing other than acting as a door-stop. If you actually used it, you had (maybe) 20 minutes talk-time and the battery was done.
I remember my car breaking down in the middle of nowhere in the Peak District (in England) and - after recovering from the surprise of actually having cell coverage - manually hibernating my Motorola flip-phone (i.e. turning it off every so often) in a bid to keep enough juice available to guide the breakdown recovery vehicle to my location. You could say I had a heightened interest in battery life that day.
But the question of how long a battery will last is an enduring one. If you’re designing a battery-powered application it’s a question that will no doubt come your way. How would you answer it?
Simple Sums?
You might be tempted to simply divide the battery’s capacity (in Amp hours) by the average expected current drain (in Amps). You would get a number, but it would be laughably inaccurate – as we will discuss in a moment. What might be less funny is the effect on your company’s reputation among your customers.
Think about it for a moment. Let’s say, for the sake of argument, that your guestimate was as far as 20% off. If that is in your favour and you have more usable hours left in your battery, not only are you short-changing your customers in how often they replace or recharge batteries, your product is going to look power-hungry compared to a competitor who has done their homework and has a more accurate estimate of battery life. Doesn’t look good, does it?
On the flip side, a 20% shortfall is going to create, at best, a low level of frustration when the battery hits cutoff voltage and your product keeps shutting down long before expected. That’s going to cause some subtle reputational damage in the minds of your product’s users. But what if this happens in critical infrastructure or medical equipment? You may need to brace for some financial damage along with whatever battering your reputation takes, if the result is injury or death.
Battery Physics
If batteries aren’t really your ‘thing’, you may be wondering why your back-of-a-cigarette-packet calculation for battery life could be so wrong. The problem ultimately comes down to the fact that no real-world battery is an ideal voltage source.
All batteries have an internal resistance, which you can define simply as opposition to the flow of current within the battery itself. There are two sources for this resistance: electrical and ionic. Together they make up the total effective resistance, which is also referred to as the equivalent series resistance of the battery.
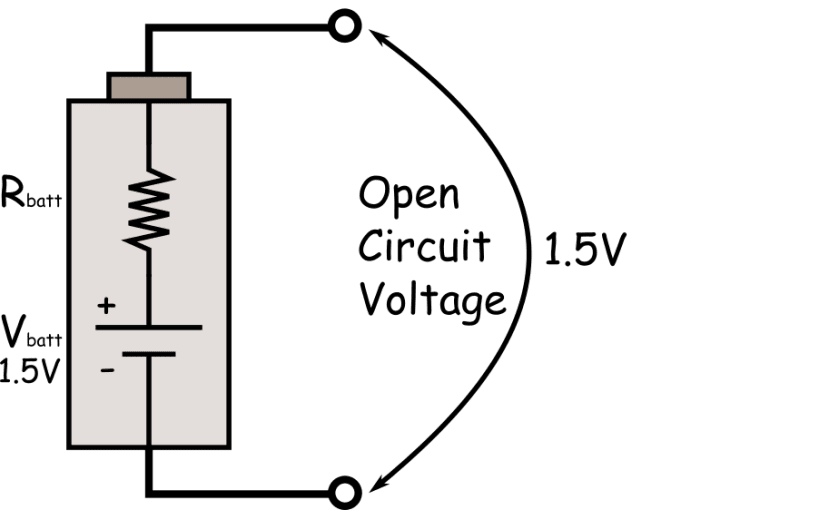
Figure 1 Open Circuit battery with internal resistance
When talking about the electrical component of this resistance, we are thinking about the resistivity of the metal covers and internal components as well as the quality of the physical contacts between these materials.
The ionic part of this resistance is down to electrochemical factors like electrolyte conductivity, ion mobility and the surface area of the electrodes.
The most obvious effect of this resistance is that it forms a voltage divider with any load on the battery. This will become more noticeable with a smaller load value.
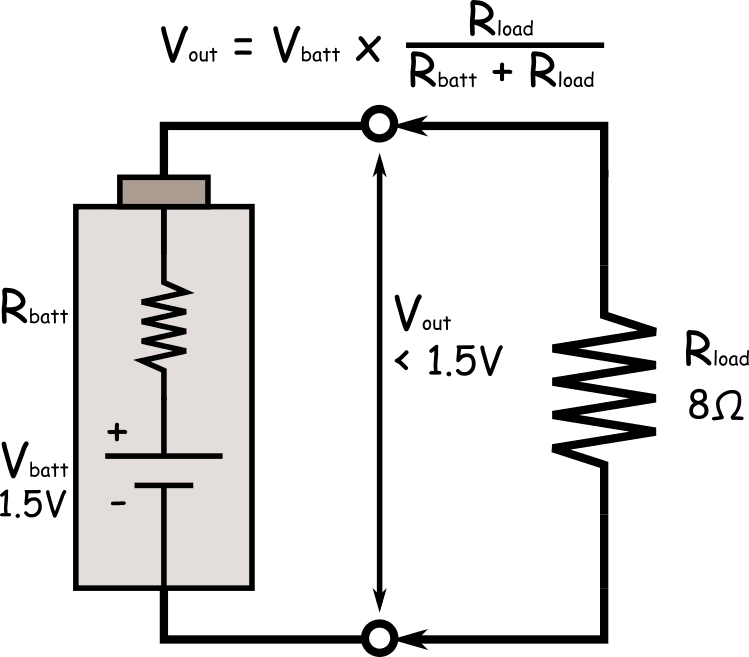
Figure 2 Battery internal resistance form a voltage divider with the load resistance
For example, a standard new AA alkaline battery will typically have an internal resistance around 0.15Ω so the value of Vout in the circuit above would be about 1.47V. That may not seem to present much of a problem to our calculations but the more insidious feature of internal resistance is that it is non-linear over various factors; and this is where our simple sums fall apart.
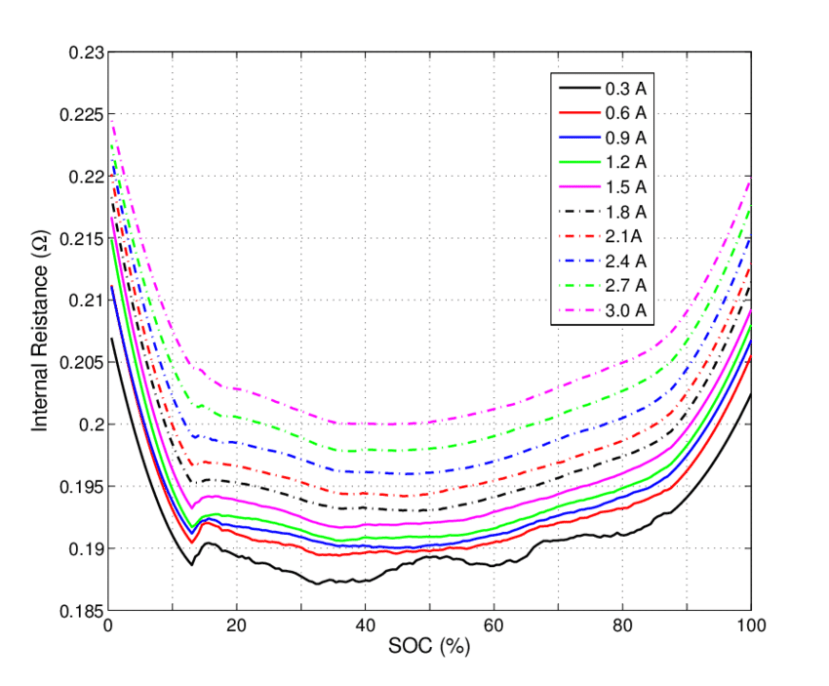
Figure 3 Internal resistance variance for a LiON battery over different current drains and states of charge (SOC)
As you can see from the graph above for a Lithium-ion battery, the resistance parameters change with both the magnitude of the discharge current and the State-Of-Charge (SOC) level. These characteristics will also vary wildly between different types of battery, depending on the electrolytes and construction techniques used.
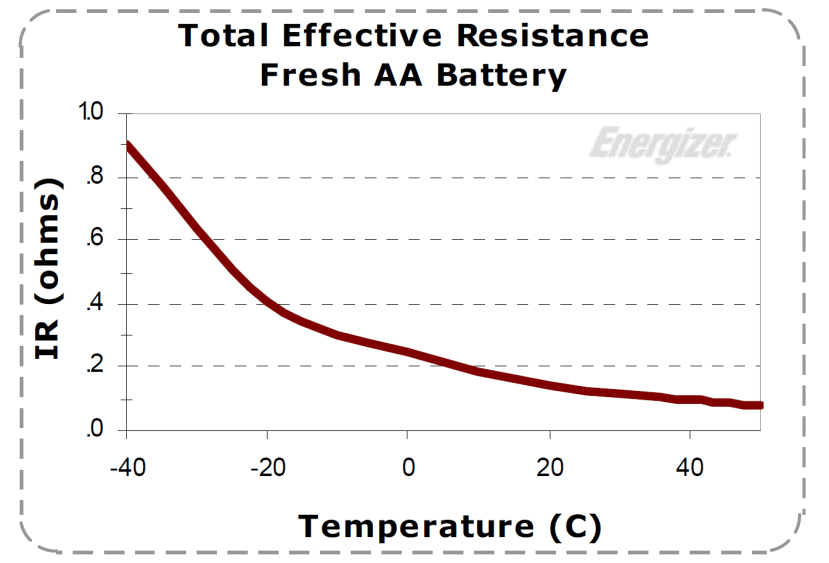
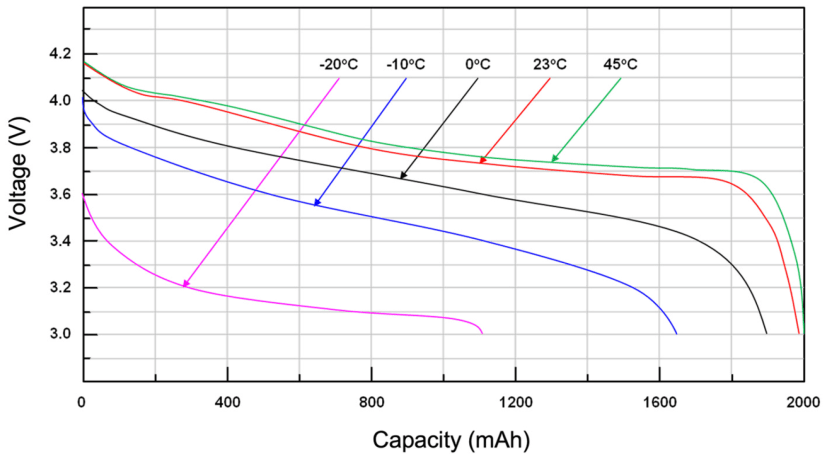
Figure 4 Temperature affects both internal resistance and charge capacity
Electrochemical reactions will also slow down, reducing ion mobility, as temperatures drop - causing an increase in internal resistance and a drop in charge capacity as the thermometer heads south. All of these factors will also cause variance in the battery’s performance in reacting to current-draw pulses: the essential element of the hibernation and short-activity-period mode of operation used by so many low-power applications.
Case Study
At this point, you may be thinking to yourself something along the lines of “OK, I can see that you’re going to get some variance in battery performance; but come on Redstone, aren’t you blowing this out of proportion? How bad can it be”?
So glad you asked. To give you some real-world perspective let me relate the experience of a UK manufacturer of consumer-grade devices. Their product needed to be as small and light as possible, so they contracted an IC supplier to deliver an ASIC that could perform all the functions required by the product.
The power consumption data the IC supplier provided for the delivered ASICs indicated that there was a reasonable expectation for 6 to 8 years of battery life from the coin cell used as the sole power source for the device. That was even better than the UK manufacturer had expected. The product was rolled out and it sold really well.
However, within a year, the company’s customer services were being swamped with irate customers returning failed devices and demanding refunds. Two things were clear:
- This kind of financial hit was not sustainable for much longer, and
- All these returns had an exhausted coin cell.
In a bid to figure out what was going on here, the engineers at the company got hold of some of the emulation and power analysis kit that we will talk about at greater length in a moment.
They quickly discovered that the peak current drain on the battery was far higher than they expected. That made no sense. Had the IC manufacturer produced fake measurement data?
Not exactly. It turned out that their supplier’s current measurements were made using some pretty antiquated digital meters and data acquisition equipment that modified the load characteristics of the device when connected to it. This significantly reduced the peak current draw on the battery, greatly extending its life under test conditions. This modified loading was, of course, not present on deployed devices.
The product was quickly redesigned and fresh operational measurement data was taken using the advanced characterization capabilities of their new emulation kit. This made sure that all the design goals were met before the new product was released.
The marketing department had their work cut out for them to regain the company's standing with their customer base, but the returns nightmare was over.
Emulation to the Rescue!
It’s a lot to take in, but tackling these complicated issues is the whole point of battery emulation equipment like Keysight’s E36731A Battery Emulator (260-3060) ; which is designed to work hand-in-hand with their BV9211B PathWave BenchVue advanced battery emulation software, that you run on your computer, to create a comprehensive battery test environment on your workbench.
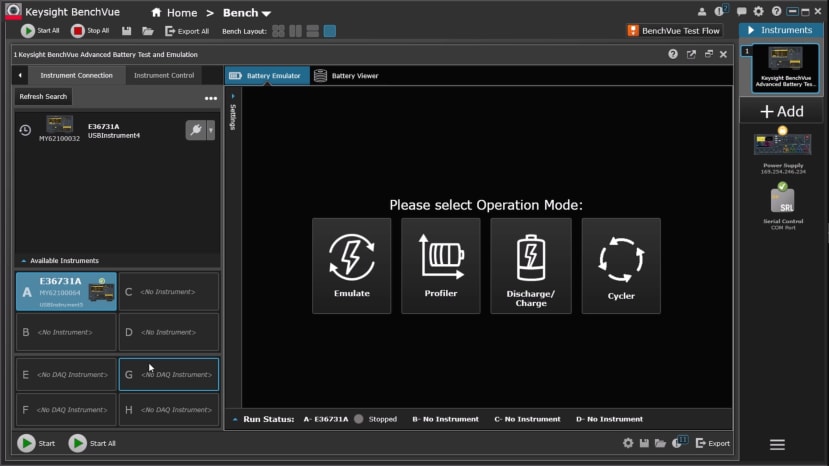
Figure 5 Start screen for BV9211B PathWave BenchVue
The hardware and software together allow you to profile, emulate, charge/discharge and cycle real-world batteries and use this information to asses and improve your application. How? Let’s briefly go through each of these activities, so you can see the way this all fits together.
Profiling
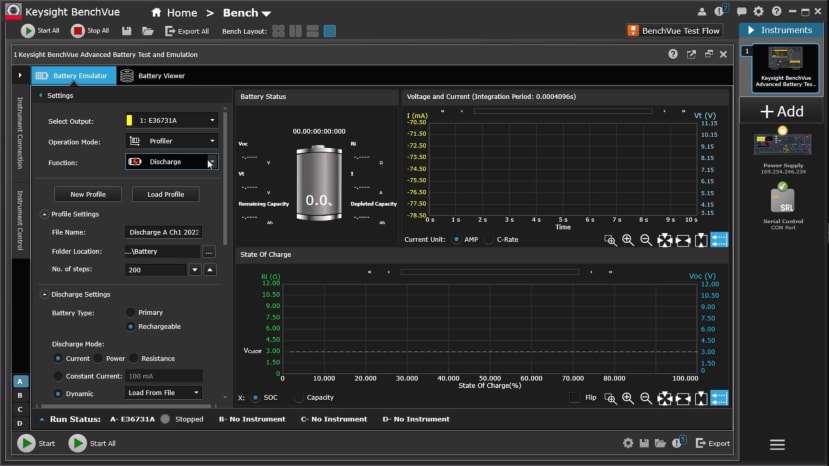
Figure 6 Battery profiling
Profiling is how you capture the characteristics of a real, physical battery as it is charged or discharged over time. These characteristics can be captured under constant conditions where the battery is discharged under constant current, power or resistance loading conditions. Alternatively, you can capture a profile under dynamic conditions, where you can load a model to simulate the actual current-draw profile of your application. At the same time, you can take input from a DAQ to record the battery temperature as it discharges.
Ultimately, this allows you to create a custom, digital battery model that actually matches your real-world use case.
Emulation
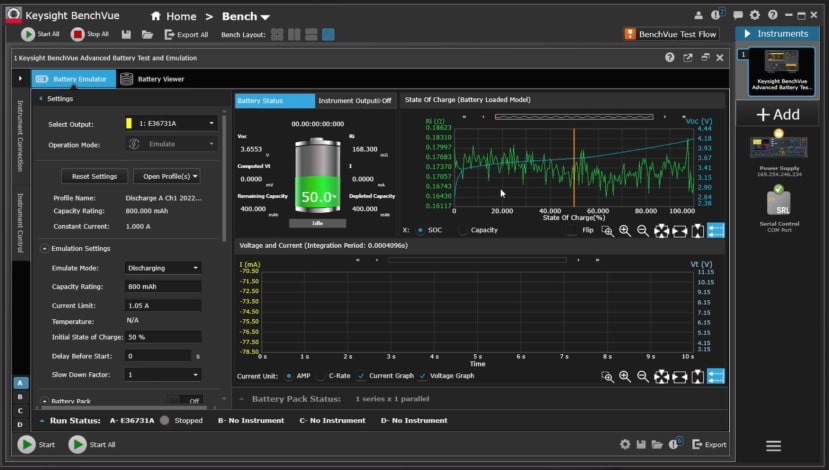
Figure 7 Emulating with a previously profiled battery
The great thing about capturing a battery profile is that you have a known, fixed reference for all your subsequent tests. Battery characteristics can vary between batches but when you use an emulated battery, you can be sure that the battery plays no part in any shifts in current drain: the shift is entirely down to the hardware or software changes you are testing.
You can also load multiple profiles created across a range of temperatures or even generic models (from a battery manufacturer, for example) containing Voc, SoC, and Ri parameters in a csv file. This battery repeatability is a valuable element of the optimisation process for any battery-powered application.
But that’s just the beginning: you can analyse your application’s current drain from any state of charge, instantly and repeatably, by simply setting it in the software. Have fun trying that with physical batteries.
When running your tests, the emulator continuously monitors the application’s current draw and dynamically calculates the SoC for your emulated battery. At the same time, the emulator is dynamically changing its output voltage and internal resistance to match the battery profile. If you leave it to run, the test will continue to drain your emulated battery until the output reaches your pre-selected cutoff voltage.
Charge / Discharge
As an aspect of profiling, we have already mentioned how the hardware and software combination supports constant current, constant resistance and constant power modes of discharging a battery, as well as dynamic models of discharge.
What we haven’t mentioned is the support for both constant current (CC) and constant voltage (CV) modes for charging batteries. As a battery reaches full capacity when charging using CC mode, the software smoothly transitions into a combination of CC and CV, as a battery cannot be charged at the same rate when nearing peak voltage or peak capacity without risking overcharging. Logging the charging data means you are also creating a charging profile for the battery.
Charge Cycling
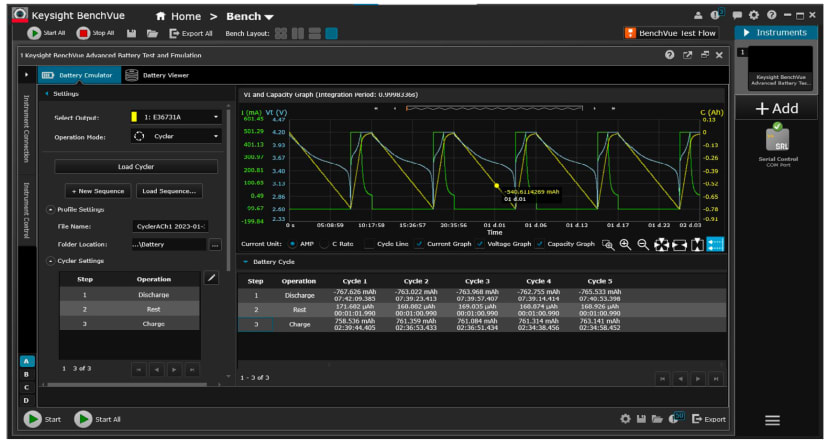
Figure 8 Charge cycling a rechargeable battery
You don’t have to be a battery expert to know that the performance of rechargeable batteries declines as the number of charging cycles increases. How can you determine the effects of this decline on your application’s operation?
The charge cycling function allows you to create a customised sequence of charging, rest and discharging for various test conditions on your battery for up to one thousand cycles.
The software collects voltage, current, time and charge capacity data over each of the cycles to create a comprehensive profile of battery ageing effects. The test can be set to stop once a preset capacity loss is reached. This profile data can be used to determine the effects of battery ageing on the performance of your application.
But that’s not all…
Saving Bench Space?
The emulator hardware has a two-quadrant architecture, which means that as well as supplying positive voltage outputs, it can source and sink current. This means it can act as a power supply and an electronic load.
As a power supply, the E36731A (260-3060) can output up to 200 W: with a current maximum of 20 A, and a voltage maximum of 30 V. Auto-ranging technology means the highest current available is supplied at all output voltages.
As a load, it will handle up to 250W; sinking up to 40 A of current while supporting voltages of up to 60 V. A dynamic load profile can be used to test the transient response of your power source.
The electronic load function, like the power supply function, allows you to continuously log voltage and current to a data file. You can either save the data file internally or export it as a CSV file to a USB drive.
Final Thoughts
Battery profiling and emulation open up a whole new vista for optimising an application’s power use in as close to real-world operation as you can get, while still on the test bench. They also allow you to generate reliable estimates for battery life for any given operating environment.
If you are serious about developing IoT, infrastructure or medical applications reliant on battery power, you probably do need a battery emulator. The BV9210B software is even available for download with a 7-day free trial. Why not follow the links on this page and start your emulation journey from there?
Comments