The Dream Lantern: Part 2
Follow article
 Dave from DesignSpark
How do you feel about this article? Help us to provide better content for you.
Dave from DesignSpark
Thank you! Your feedback has been received.
Dave from DesignSpark
There was a problem submitting your feedback, please try again later.
Dave from DesignSpark
What do you think of this article?
I’m making a lantern that uses coloured addressable LEDs to create an animation that changes based on the local air quality data. In my last article I described the objectives and process of this project. Here, I describe how the final form came together.
Assembling the ESDK
The lovely people at DesignSpark sent over the ESDK, the device that detects the air quality wherever it’s put. My first task here was to assemble it, following their instructions. After a few false starts, I got it all set up so it was ticking away happily. It has a Raspberry Pi computer inside it, which puts the sensor data on a screen and runs an MQTT broker (more of which later). I used a trick to put the threaded inserts into the 3D printed chassis without using a drill - you can push them in (carefully!) using a soldering iron, and let them cool in place. See my video of this for more info.
The lantern itself
I had a rough idea of what I wanted the object to look like, so I made a few mock-ups in different materials: I set myself the task of creating at least ten different quick versions, using paper, mesh, copper, cork, wood veneer and cardboard.

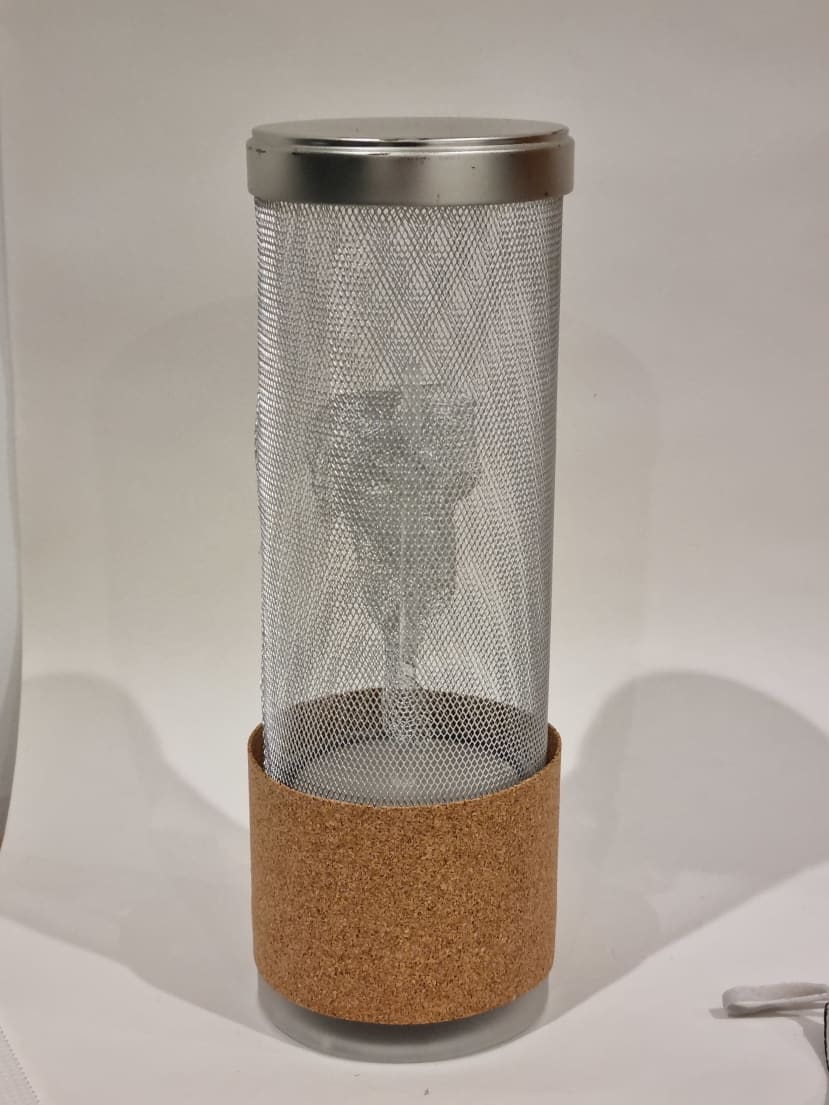
I settled on a design using aluminium mesh to create a shape a little like the original Davy lamp. The light from the LEDs passes through a double layer of PVC which acts as a diffuser. In the centre of the lamp is suspended a piece of twisted and coiled mesh, which has a passing resemblance to a curl of smoke - it catches the light coming from below, and enhances the sense of volume in the cylinder.
Wiring
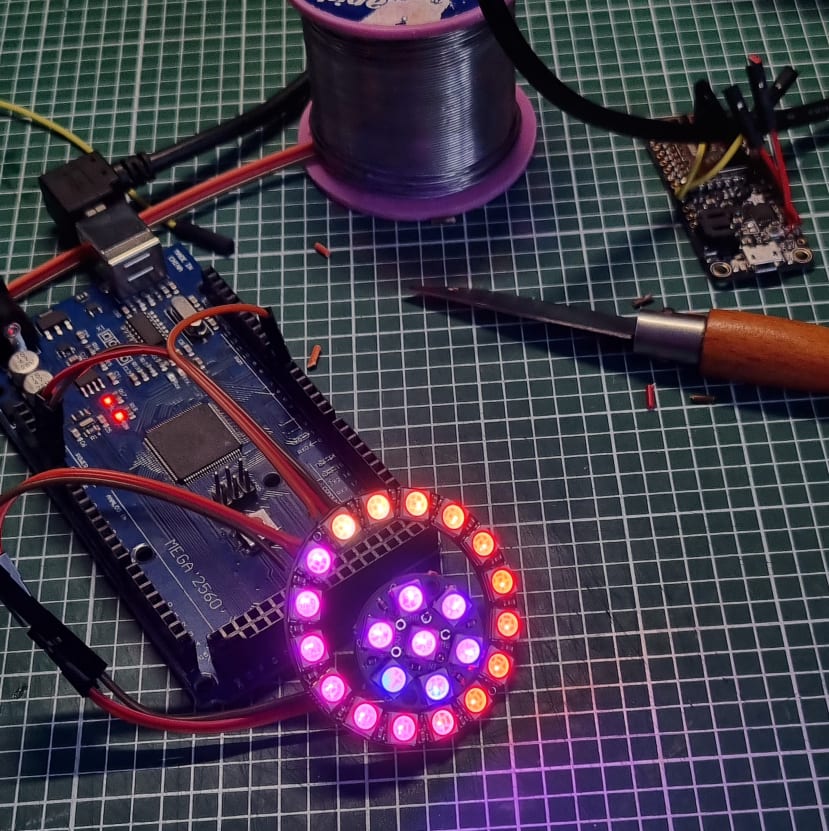
To put the electronics together, I spent a bit of time on soldering good quality joints, as I wanted to be able to try a few different lighting layouts and didn’t want the thing falling apart in the process. In the animations I showed in the last article, I was using two separate LED functions in the code, to run functions on two different LED strips. Since then, I’ve worked out how I can run separate animations on different sections of the same strip of LEDs (For more detail you can check out the code, which will be appearing on GitHub soon). This means I can make the wiring much simpler, as I can daisy-chain the LED rings and have them all controlled from one Arduino pin.
Code development
In addition to the ‘sine wave pulse’ and ‘pop and decay’ animations I described in the last article, I also wrote a few other functions that can add just a little random noise to the colour and/or the brightness of certain LEDs within a chosen range.
I'm using an Adafruit Huzzah board, which has WiFi capability and is based on the ESP8266 chip. The script I wanted to run on this board would have to do a lot of different things at once, so to aid debugging broke this all down into tiny steps, and get each thing working separately and in sequence.
- Get LEDs working on the new board.
- Get the wifi + MQTT working, and responding over serial (text only)
- Subscribe to an MQTT topic ‘test’ and if it = 1, then change the colour to red. Otherwise, it’s green.
- Subscribe to an MQTT topic and convert the topic into a value to feed directly into the LED colours (eg. an integer that I could map to the Hue value for the LEDs).
- Change the animations in the lantern by publishing to MQTT
- And finally… Have the ESDK values feed directly into the lantern animation inputs
For the simplicity of the animation design, I decided that it should be driven by CO2 only, though it would be easy and instructive to include VOCs and particulates in future. At 400ppm CO2, the animation should look like a happy, fairly calm flickering flame, like a gentle candle. At 800ppm (a normal reasonably well-ventilated room), there should be a bit of yellow flicker. At 1200ppm, we want the user to be aware the air is a bit funky, so the animation should be getting reasonably urgent, and flickering with a bit of a blue tinge in the colour. At 1600ppm and beyond, it’s getting a bit more desperate and is increasingly trying to attract attention to itself.
I’ve tried to map these values into different quantities in the animation, using linear interpolation to get a smooth grading between these points.
To bring in the numbers for outdoor AQ, I wrote a python script that runs on the ESDK raspberry pi every 10 mins: it looks at the Open Weather API, checks the air quality at my location.
It would be possible to rewrite this to something more scientifically grounded - but for the sake of demonstrating an animation, I decided to simplify the data into a single score of ‘badness’. The script looks at the local ozone and particulate levels (PM2.5 and PM10), and simply divides each one by a number that would be ‘high’ - as an initial value, I’ve used the WHO exceedance values (10ug/m3 for PM10, 35 for PM2.5 and 100 for ozone).
This division operation produces three numbers, each of which is a measure of how bad the air quality was at that time. Whichever one is highest, then gets published to an MQTT topic, which the lantern is subscribed to.
I wanted these numbers to link to the row of LEDs on the base of the lantern, giving a sense of ‘sickness’ in the air outside. The higher this ‘badness’ number, the more the LEDs ‘blip’ into the wrong colour. This effect is only applied to the lights on the base.
As you can see in the final demonstration video, it's all working nicely and shows a pronounced shift in the animation. I think I'd like to play with the animation a bit more in future, as I suspect that with a bit of experimentation it could be interpreted more intuitively. That said, it's been a lot of work to get to this point and I'm pretty happy with where it's got to!
Comments