SeeTide
Follow project
 Dave from DesignSpark
How do you feel about this article? Help us to provide better content for you.
Dave from DesignSpark
Thank you! Your feedback has been received.
Dave from DesignSpark
There was a problem submitting your feedback, please try again later.
Dave from DesignSpark
What do you think of this article?
 Make a visual indicator of the current state of the tide. Uses IBM's Cloud, a WeMos and some neopixels. (Not to be used for Navigational Purposes).
Parts list
| Qty | Product | Part number | |
|---|---|---|---|
| 8 | Adafruit NeoPixel Digital RGB LED Strip | 1376 | |
| 1 | Kingbright L-53HD, Solid State Lamp 660 nm Red LED, 5mm (T-1 3/4) Round Through Hole package | 228-5988 | |
| 1 | Kingbright L-53GD, Solid State Lamp 568 nm Green LED, 5mm (T-1 3/4) Round Through Hole package | 228-6004 | |
| 1 | WeMos https://wiki.wemos.cc/products:d1:d1_mini | ||
| 1 | Stontronics, 10W Plug In Power Supply 5V dc, 2A, 1 Output, European Plug | 822-6373 | |
| 1 | Polyplumb PVC Pipe, 2m long x 22mm OD | 784-5743 | |
| 1 | Plain Box e.g. https://www.amazon.co.uk/dp/B07J2DF4VM | ||
| 1 | Carbon Resistor, 0.25W ,5%, 100R | 707-7587 | |
| 1 | Carbon Resistor, 0.25W ,5%, 150R | 707-7603 | |
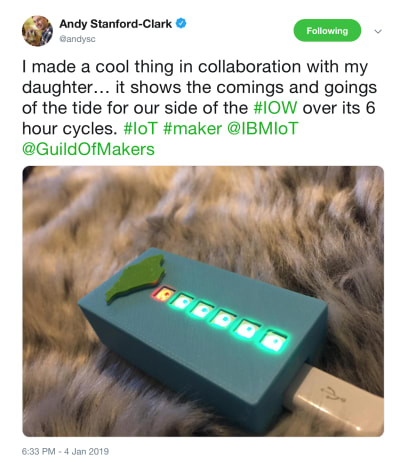
Last year Andy Stanford-Clark and I discussed how to "see" the state of the tide. Andy spent time over Christmas and made this version with his daughter ...
He has very kindly made his software available to all using the Apache License, Version 2.0.
What it does:
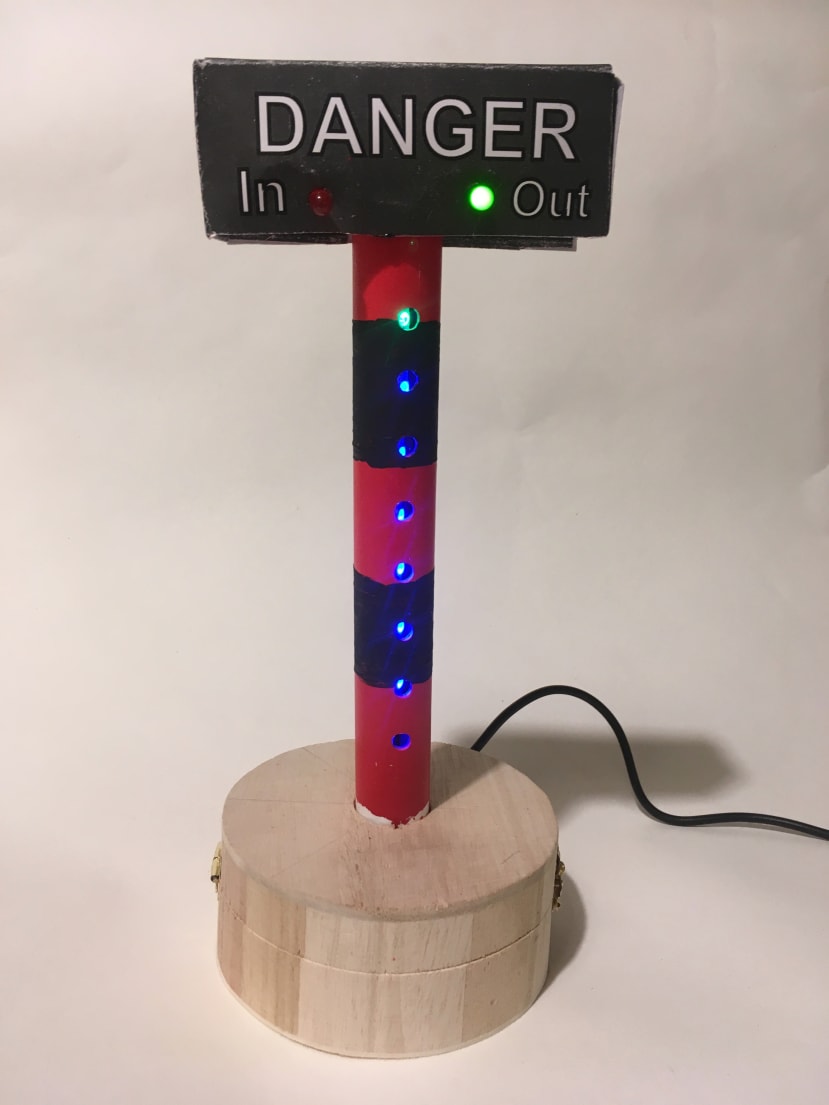
Tide data for your local port is scraped from the UK Hydrographic Office website. This is then displayed visually on a strip of neopixels - with blue representing how far "In" the tide is, and green representing the amount left to come in / how much it has gone out. Red and Green LEDs show if the tide is coming in or going out. The tide information is updated every day at midnight, and the lights refreshed every 5 minutes.
Please note this uses simplified approximations of the tidal flows for the given location, and must under no circumstances be used for navigation or for any purpose that could in any way endanger life.
How Andy's calculator code does what it does:
Tidal data is scraped from the UK Hydrographic Easy Tide web site once a day, and the flow creates a number of sine-wave models of the day's tide, peaking and troughing at the correct high and low tide times.
The model is then run every 5 minutes to compute how far in or out the tide currently is, and formats a string of RGB colours to send over MQTT to a neopixel display device that displays the green/blue mix to show land and sea.
The flow also uses cos (the first derivative of sin) to work out whether the tide is coming in or going out, and adds that onto the front of the colour string as a flag, which the device uses to light an LED indicating "in" or "out" direction.
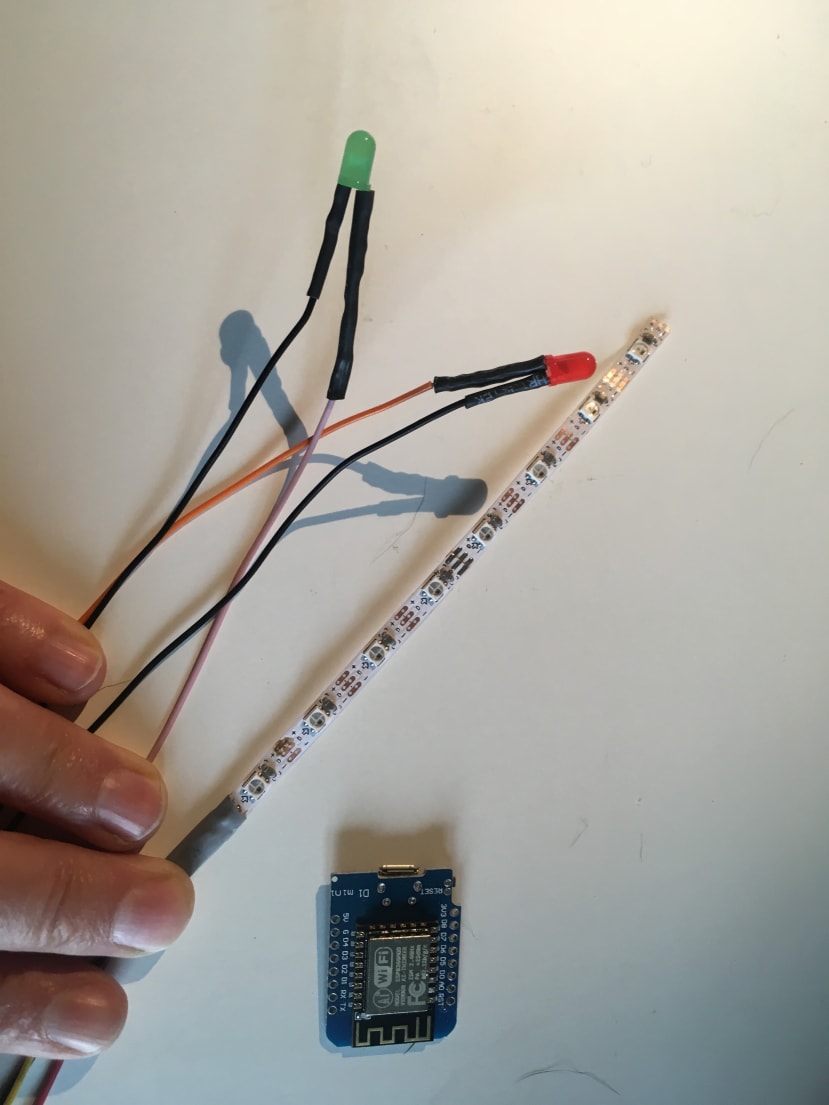
Step 1 Make the electronics (Part a)
Connect the WeMos, Neopixels, resistors and LEDs as per the drawing below. The resistors for the LEDs were calculated by trial and error - how bright the LEDs looked when powered up.
The neopixel strip in this project has 8 neopixels in it. If you change this it will need to be changed both in the Arduino code and the Node-RED flow (where it calculates how far in the tide is).

(My breadboard is never as neat as the drawing!)

Step 2 Connect your WeMos to the Cloud
Connect your WeMos to an IBM Cloud Node-RED flow by following the steps in
https://www.rs-online.com/designspark/content-types/project/13257?lang=en
Be aware:
On the above project, the Neopixels were connected to pin D2, so you need to change the Arduino code so they are now connected to D6.
With this software, the red and the green LEDs won't be used. We'll fix that later.
Step 3: Get Tide Data
- Go to: http://www.ukho.gov.uk/easytide/EasyTide/index.aspx
- Click on "Free Predictions for today and next six days"
- Select your port
- Once you have clicked on the port of choice, you can see the PortID in the web address it takes you to. You will need this later.
e.g. If I click on Portsmouth, the web address is: http://www.ukho.gov.uk/easytide/EasyTide/SelectPrediction.aspx?PortID=0065 So the PortID for Portsmouth is 0065 - Click on "Predict" to see the tide information.
Step 4: Get a licence to use the Tide Data
- To reproduce / use tide data you need to get a licence from the supplier of the information. I use the Admirality Easy Tide by the UK's Hydrographic Office - You can apply for a free online licence: - "Licences to reproduce our material for non-navigational and non (or low value) commercial purposes can be obtained online"
- It's a simple step-by-step process available at http://www.ukho.gov.uk/copyright/OnLineApplication.aspx
Warning: Once the form is complete it says it will send you a draft licence within a few minutes. Mine took four days to arrive. - Do take the time to read the terms and conditions. You need to put the following copyright notice on webpages that use the data, although it is not clear how this translates to a physical visual tide height representation.
Tide data is © Crown Copyright and/or database rights. Reproduced by permission of the Controller of Her Majesty’s Stationery Office and the UK Hydrographic Office (www.GOV.uk/UKHO).
Step 5: Reprogram the WeMos
Instead of all the neopixels reacting at once, we want some to turn blue and some to turn green, showing how far the tide is in. We also want to light the LEDs to show if the tide is coming in or out. This Arduino code will do that - update the WeMos.
The decision as to whether the tide coming in or going out should be red or green is down to personal choice and depends on usage. For my application, I wanted to be "warned" that the tide was coming in, so I chose that as red.
The code is in the attached file tide-thing3.ino
Step 6: Manipulate the Tide Data
- Copy and paste the Tide Model Calculator flow from the NodeRed Library directly into your Node-RED session on the cloud.
- Copy the code, then on Node-Red add a new sheet by clicking the "+" above the working area.
- Then click the Menu 'hamburger" symbol at the top right. Click Import, Clipboard and then paste the code and click import. It should now show on your sheet.
- On the node that says "Get Tide Data" you need to replace the Port ID with the Port ID that you require (which you got in Step 3).
- There are two blue IOT Nodes - an output and an input. Put in both the Device Type and the Device ID you generated in Step 2.
- IMPORTANT: On the blue IOT input node, make sure the Input Type is "Device Event" and the Event is "status".
Be aware - if you want to add a second WeMos device, you need to get separate details for it.
Node-RED flow Error Message

If you get a 401 error warning when you try to inject something in Node-RED, check that you are still logged in to your node-RED flow. It logs you out if you restart the app or if you go to the app from a different browser etc. or stay logged on for a week. (the next version of Node-RED is expected to have a more user-friendly error message that lets you know that you're not logged in).
Step 7 Make the Electronics (Part b)
Once it is all tested and working correctly, make it all more permanent by soldering and using heat shrink..
As there are three grounds that needed to be connected to the WeMos, I joined the LED grounds together, and covered with heat shink.

Step 8: Make the display
You can make whatever display suits your purposes. Here's how I made the Danger Sign.
I used a plain box available on the internet to house the Wemos and drilled a 20mm hole drilled in the top for the pole and a small hole in the side for the charger plug.
The pole is a spare piece of 20 mm plumbing pipe. It was sprayed red, with the black being painted on by hand afterward. The holes for the neopixels to shine through were drilled by hand.

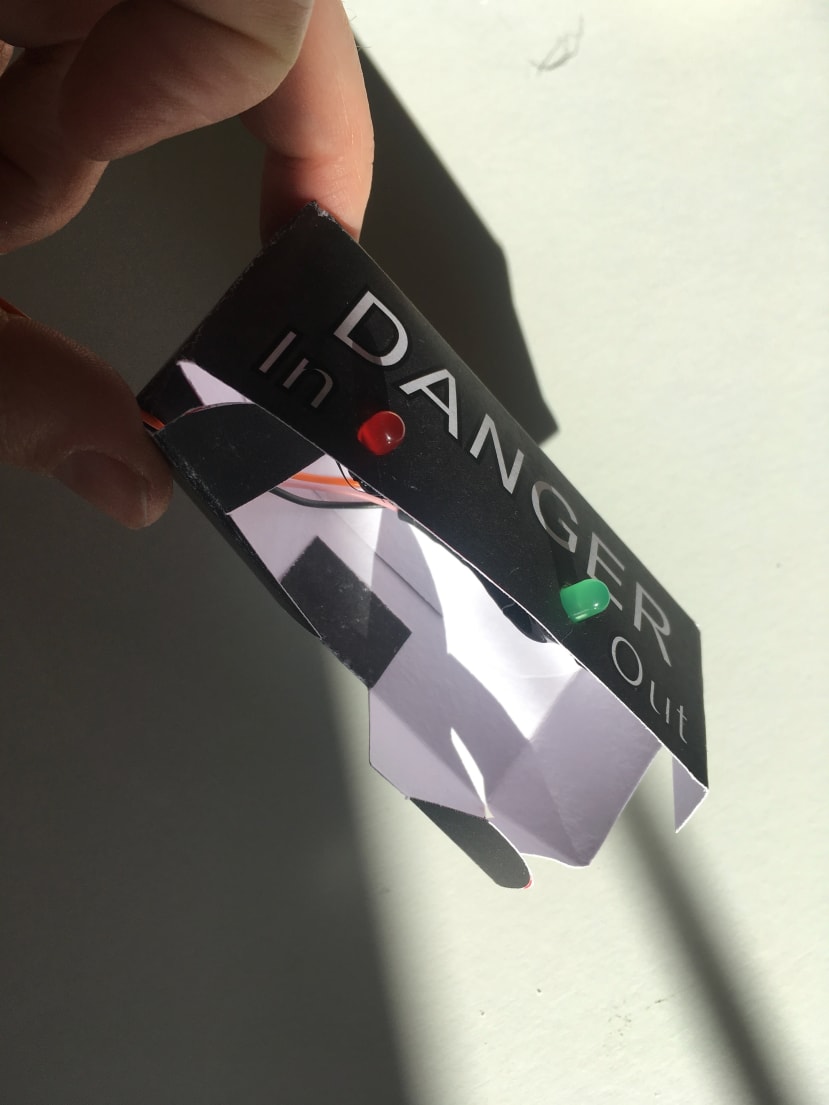
The Danger box on top was made from card. Initially, I used a paracetamol box to get the right dimensions.

Then I designed the final box using the excellent TemplateMaker.nl website. The card I used was thin enough to go through my laser printer, so I could add the words and print the grey colour directly on to it.

The parts and red and green LEDs were assembled using hot melt glue.
To attach the neopixels inside the pole, I used red insulating tape and a knitting needle to press it in place.

Ready to go ...

REMEMBER - this is not to be used for navigational or safety purposes.
All tide data via UK Hydrographic Office: © Crown Copyright and/or database rights. Reproduced by permission of the Controller of Her Majesty’s Stationery Office and the UK Hydrographic Office
Troubleshooting
If you discover that the SeeTide display is out compared to the actual time, make sure you are using the "local" IBM Cloud instance - if you are in UK makes sure you select the London one when you set up your IBM cloud account.
Acknowledgements
Thanks to IBM's Andy Stanford-Clark for writing all the Node-RED code and the Arduino sketch for this project. And for doing all the maths to map tide data to a sine wave etc.
Comments