Monitoring energy consumption with Pico CM3 Current Logger and Raspberry Pi
Follow article
 Dave from DesignSpark
How do you feel about this article? Help us to provide better content for you.
Dave from DesignSpark
Thank you! Your feedback has been received.
Dave from DesignSpark
There was a problem submitting your feedback, please try again later.
Dave from DesignSpark
What do you think of this article?
When Pico recently released a version of PicoLog data logging software that runs on the Raspberry Pi, we realised that it opens up lots of new possibilities for monitoring a wide range of parameters in situations that previously would not have been practical using a laptop, particularly in unsecure locations or tightly enclosed situations, where the compact and inexpensive Pi might be ideal.
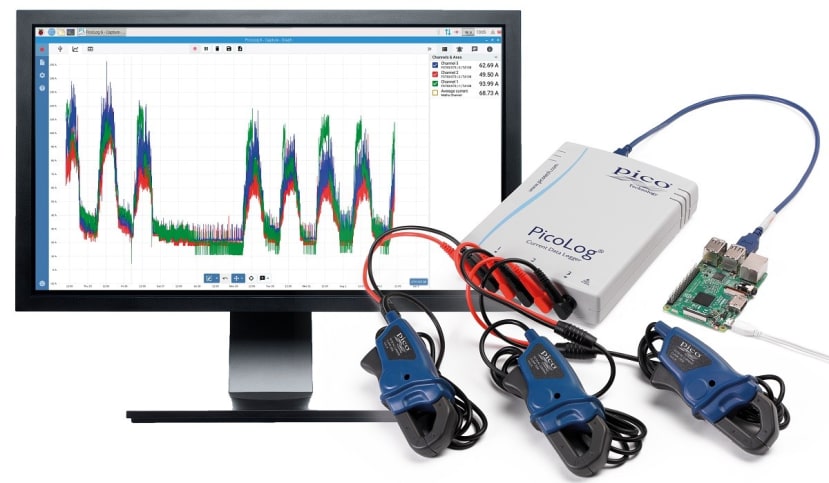
In this example, we connected a Pico CM3 Data Logger with 3 current clamps to the 3 phase mains input to one of our buildings and connected it to a Raspberry Pi running PicoLog software. Using a POE (Power over Ethernet) HAT add on board the Pi is powered from an ethernet cable and the Pi in turn powers the CM3.
The ethernet connection also allows the logger to be monitored remotely.
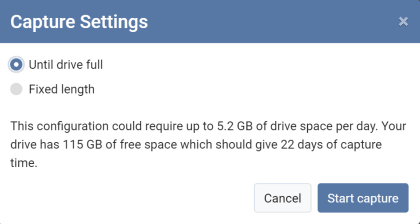
As part of the setup, the Picolog Software shows the free space available and calculates the capture time, in this case, 22 days (Dependent on the sample rate)
Once set up, the CM3 and the Pi were then slid into a 5-inch gap a the top of the mains cabinet and left to gather data.
A week later the Pi was accessed remotely using a VNC connection and a Picolog data file downloaded.
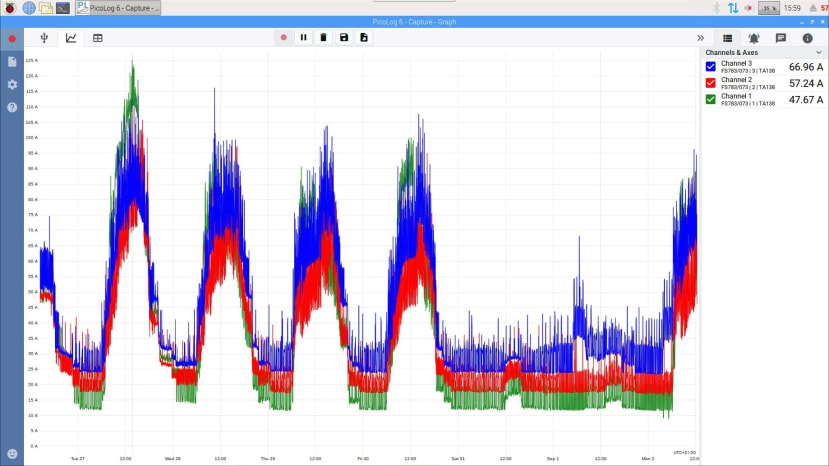
Here we see a week's worth of data with each phase coloured Green, Blue, and Red.
The working days stand out clearly compared to the weekends where there is little power being consumed.
By zooming in to one day we can see more detail:
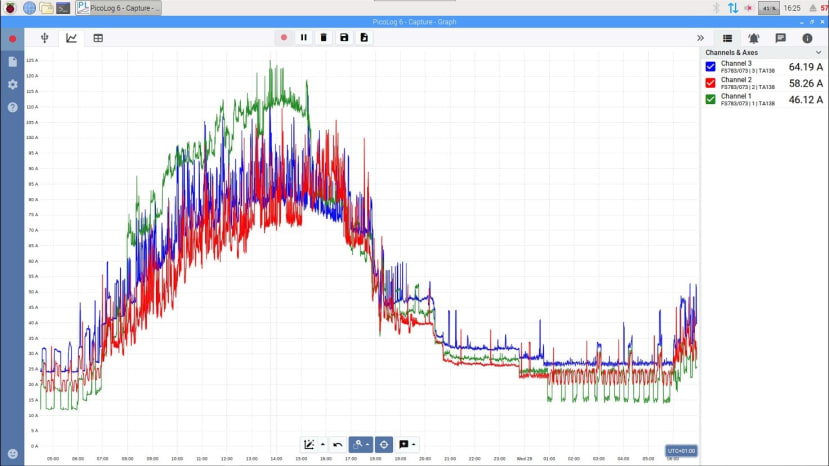
Nighttime shows the main HVAC system switching on and off and also irregular spikes that might be smaller temperature control units separate from the main system.
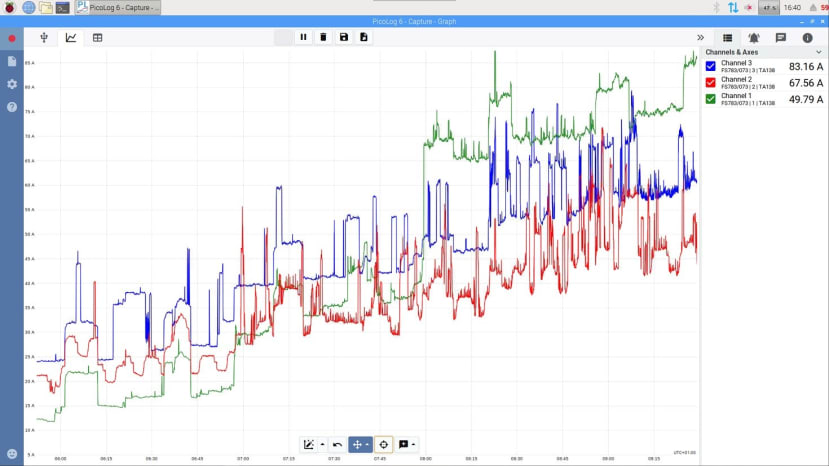
Zooming in further we can see the current draw rising with the arrival of the early bird employees after about 6.30 am, as kettles are boiled and computers and soldering irons are turned on.
At about 8 am we see an increase in the green phase when an employee connects his electric car to one of the charging points, this falls back in the afternoon once the car is charged.
The record gives us a lot of insights into how and when energy is being consumed and could help us be more energy efficient.
Picolog Software supports multiple Pico data loggers and so many parameters can be measured in the same window.
For more information on Pico Dataloggers visit www.picotech.com/products/data-logger
See the range of loggers available from RS here:
Comments