AQ Project How to Part 3: Introducing The DesignSpark Air Quality Dashboard
Follow article
 Dave from DesignSpark
How do you feel about this article? Help us to provide better content for you.
Dave from DesignSpark
Thank you! Your feedback has been received.
Dave from DesignSpark
There was a problem submitting your feedback, please try again later.
Dave from DesignSpark
What do you think of this article?
Cloud platform provides powerful time series database and analytics for Air Quality project.
In this article we take a first look at the DesignSpark Metrics platform which will be used to provide data storage and visualisation for the Air Quality project. The cloud platform builds on top of the Prometheus time series database for storage, plus Grafana for analytics and visualisation.
Prometheus

Prometheus is a time series database and what this means is that data written to it is stored as a chronologically ordered series of values.
A series in Prometheus is identified by a unique combination of a metric name and one or more labels. For example, there might be two series with the metric name “temperature”, however one with a label of “indoor” and another “outdoor”. This means that we can avoid having to come up with globally unique metric names such as “indoortemp” and “outdoortemp”, but still separate metrics when writing them and construct queries that return only the data we’re interested in.
In addition to selecting data by a metric name and one or more labels, the Prometheus Query Language also supports selecting ranges, subqueries, functions and operators etc. A HTTP query API is provided, although we’ll be using the Grafana web application for visualisation and this benefits from seamless integration with Prometheus data sources.
Writing data
Rather than being simply a passive database, Prometheus employs a pull model and is typically configured to scrape metrics over HTTP. This is particularly useful with IT infrastructure, where there may be many existing web based systems which can be polled to gather metrics and store these in one place. Or perhaps with proprietary sensor systems, where there may not be an API exposed and firmware cannot be modified, but there is a web interface which may be scraped.
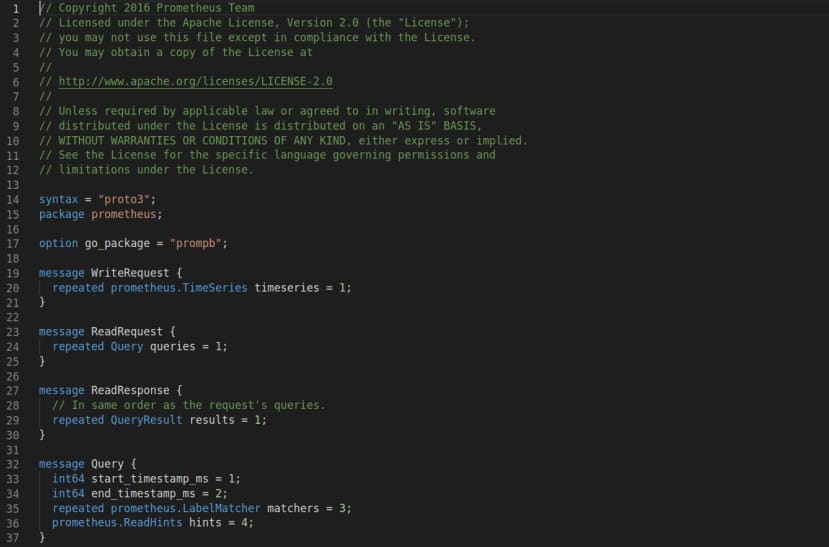
Fragment from the Protocol Buffers definition for Prometheus remote write.
In our case Prometheus is a hosted service and as such it wouldn’t be convenient to have it connect over the Internet and scrape metrics from devices located behind a firewall. However, Prometheus also provides a remote write mechanism, which again uses HTTP, but this time is based on the Protocol Buffers binary wire format. With the Air Quality project this formatting is handled by the Air Quality device application, which reads the ESDK sensors and, if a Prometheus endpoint is configured, packages readings into serialised messages which are then written to the cloud Prometheus.
Another option is to use Grafana Agent, which is essentially a cut down version of Prometheus and may be configured to scrape metrics from applications hosted on the LAN, then write these to a remote Prometheus instance. This is something which we may look at in a future article and could be useful if we wanted to collect data from a third party sensor with a web interface.
Whether using the aq-device application or Grafana Agent, in order to use the remote write mechanism the ID of the remote Prometheus instance is required, together with an API key.
Grafana
Grafana is a powerful analytics and visualisation web application, the open source version of which has been used in various projects which have been covered in articles on DesignSpark over the years. However, the hosted version provided as part of DesignSpark Metrics is a fully managed service, which means that it’s frequently updated and backed up, amongst other benefits.
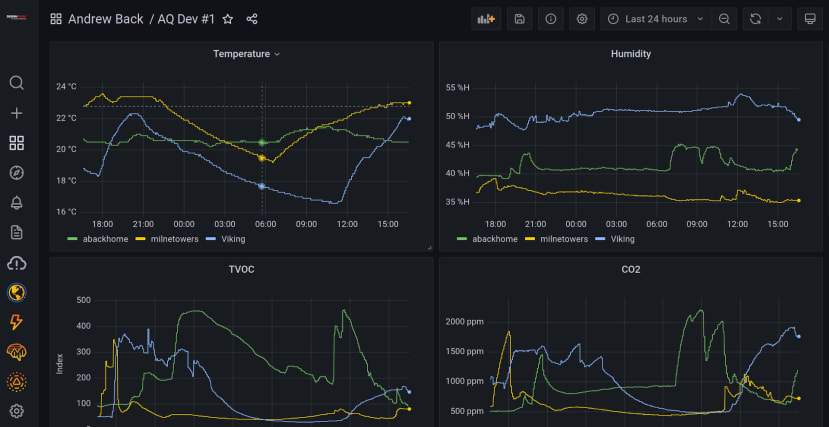
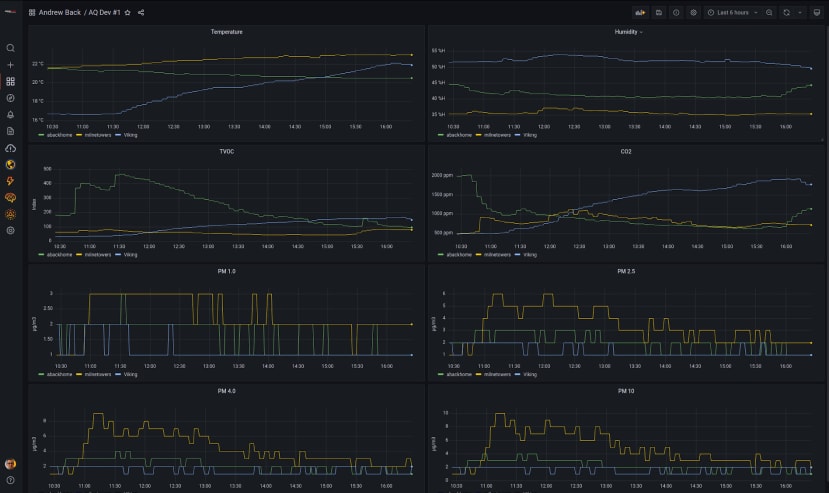
Above we can see a very simple Grafana visualisation, with line plots for the temperature, humidity, TVOC and CO2 series data, generated by ESDK hardware at three different locations.
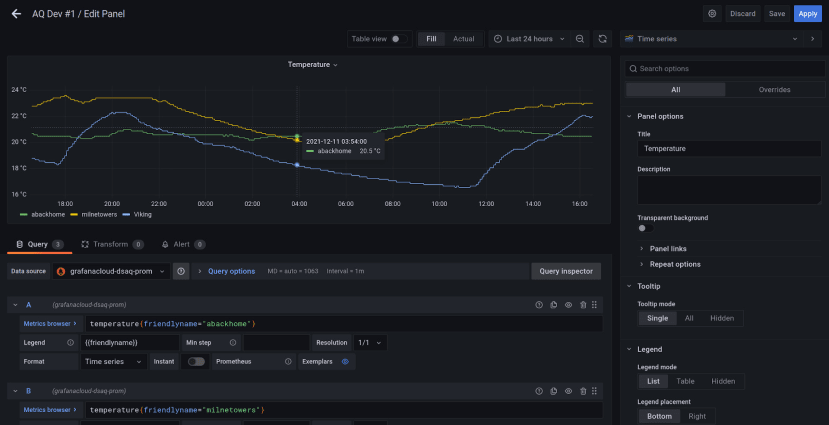
If we select to edit the configuration for the temperature plot, we can see that a Prometheus data source is being used and the first series plotted (A) is the temperature where the friendlyname=’abackhome’. Whereas the second series (B) is selecting temperature with friendlyname=’milnetowers’, with similarly a unique friendlyname for the third line (C).
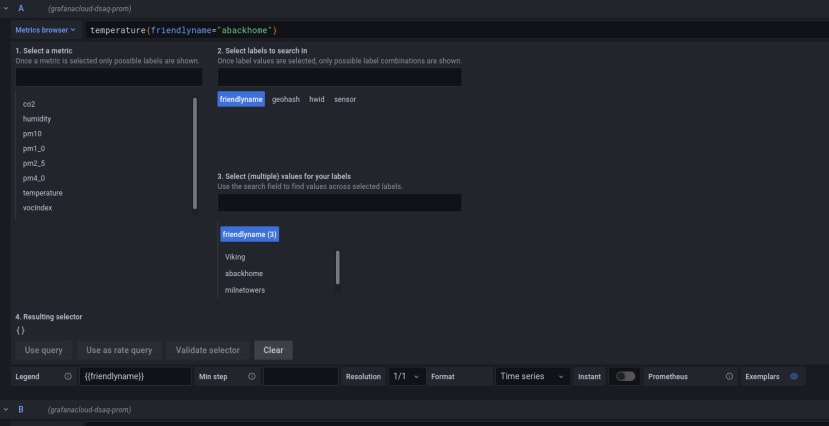
Fortunately, we don’t have to maintain a list of all the metric and label names, since Grafana features a metrics browser which we can enable, then use to point and click construct a query.
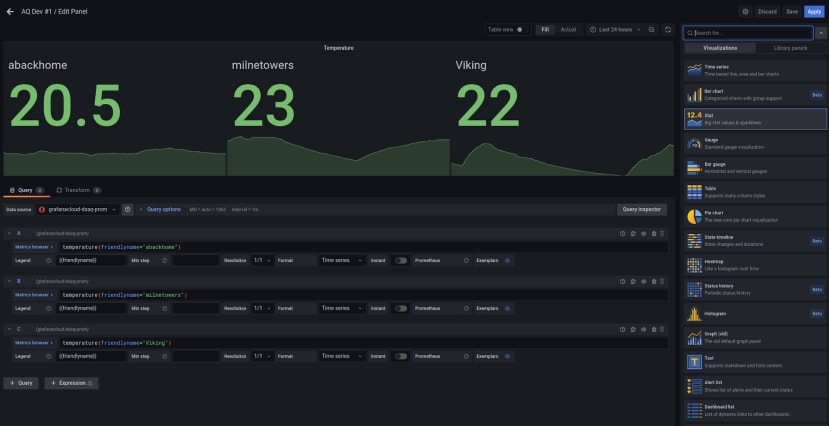
Of course, data can be visualised in many more interesting ways than simply line plots. For example, with large statistic value + sparklines, as shown above. Here we can also see on the right some of the other visualisation options that are available to use.
Air Quality project
Data model
The following additional Prometheus labels are used by the Air Quality project:
hwid. Hardware serial number.geohash. A conveniently formatted latitude and longitude.sensor. Sensor type and hardware version.
The hwid is used to uniquely identify ESDK hardware and therefore help avoid naming collisions, which might otherwise result if we relied on a user configured friendlyname alone. A geohash is simply a convenient way of encoding a latitude and longitude. The device location is important for grouping data by area, e.g. in order to create air quality “heat maps”. While knowing the type of sensor used could be important for interpreting results, and it may even be that accuracy can be further improved by combining data from multiple sensors and applying corrections.
Privacy
The DesignSpark Metrics platform will be used to host dashboards for private use, alongside public dashboards for engineer activism initiatives such as the Air Quality project. With the latter, details of what data is stored, how it will be processed and who will have access etc., will made clear as part of the sign-up process for contributing to a public dashboard.
Comments