Here comes the Sun! - Data Logging a Solar Panel.
Follow article
 Dave from DesignSpark
How do you feel about this article? Help us to provide better content for you.
Dave from DesignSpark
Thank you! Your feedback has been received.
Dave from DesignSpark
There was a problem submitting your feedback, please try again later.
Dave from DesignSpark
What do you think of this article?
I'd been wanting to do a basic introduction to setting up a Pico Datalogger for a while but was struggling to find something interesting to actually datalog.
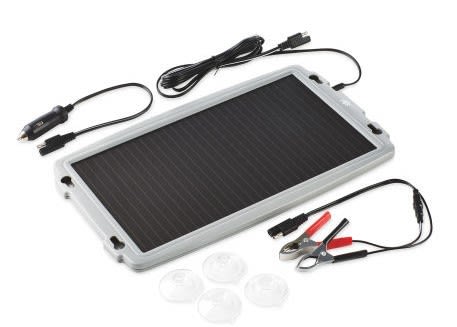
Then I saw this Solar Panel in Aldi for £15 and I thought "Bingo! I wonder what happens when the clouds come out?"
The packaging describes the panel as a “Solar Power Battery Maintainer” and this article makes no claim to test how effective it is in fulfilling its stated role.
The specs say it delivers 12V and a maximum current of 140mA into a short circuit. From this Ohms law tells me that the source resistance will be about 86Ω which gives me an idea about the kind of load resistor I need to use.
I select a 66Ω load resistor and take a walk outside with the panel and a DMM. It is a very sunny day.
First I measure the output volts into an open circuit. It is actually more like 16V.
Then I connect the 66Ω load to the output leads and that measures just under 9V across it, so now I know the voltage range I’ll be monitoring.
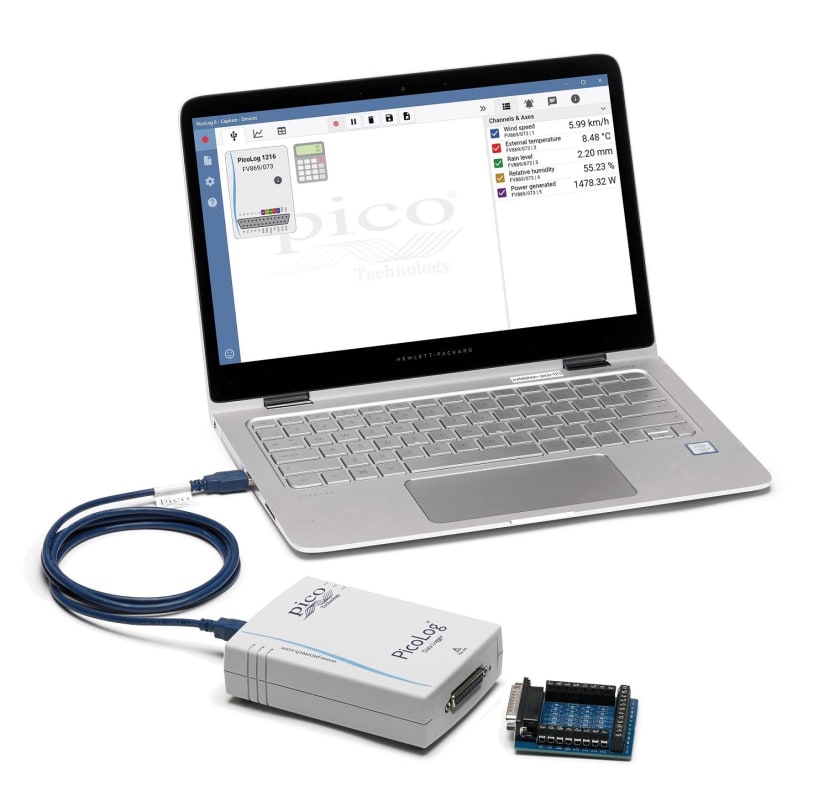
Next, I turn my attention to the data logger and for this, I’m going to use a Picolog 1000 series general purpose voltage logger, specifically the 1012 (666-8154) which provides 12 channels at 10 bits resolution.
The first consideration is how to connect to the logger and then how to set the range.
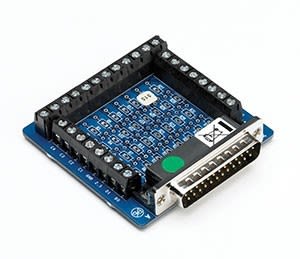
For this, I’ll need a terminal board which is an optional accessory. It has screw terminals which allow sensor wires to be attached to the data logger without soldering and also has locations where you can fit resistors to offset and extend the input ranges of the logger.
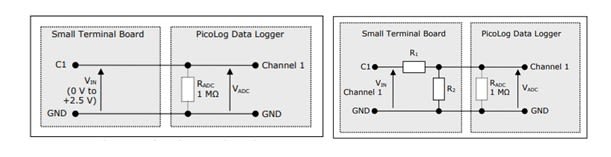
The input voltage range of the 1012 (666-8154) is 0 to +2.4V. So if the maximum input was within that range then I could connect to C1 and GND and be good to go.
However, the voltage range I want is from 0 to +10V so I will need to insert two resistors to form a 5:1 voltage divider to reduce the voltage to 2V so two resistors 1-10 KΩ range would be ideal being considerably more than the 66Ω load and considerably less than the 1MΩ data logger input
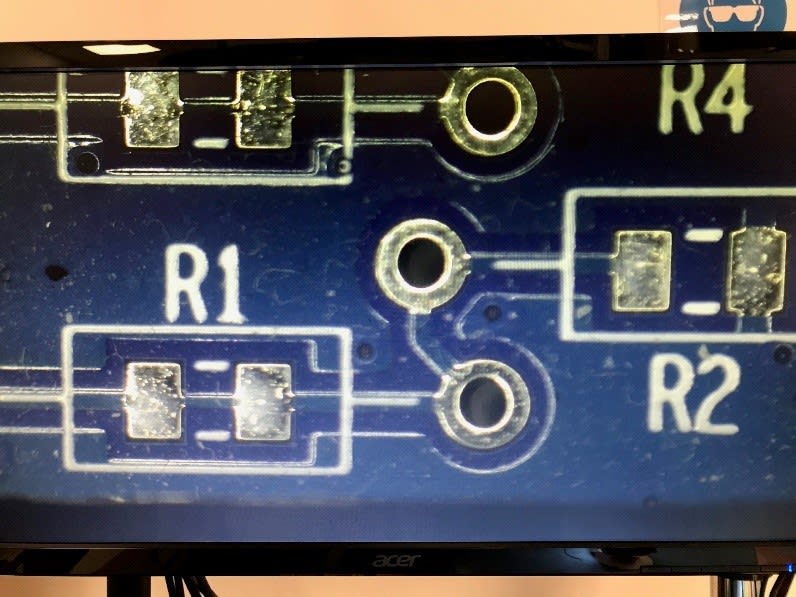
So I select a 4KΩ resistor for R1 and a 1KΩ resistor for R2.
On the terminal board, R2 is open circuit and R1 is a short, so before fitting R1 I need to cut the track with a scalpel between the surface mount pad, then I just solder in the resistors.
Then I am ready to set it all up.
I’m a bit limited as to where I can place the panel so that I can connect to the data logger and a laptop which I want safely indoors, so upright on a south facing window ledge will have to do, so definitely not showing it at its best.
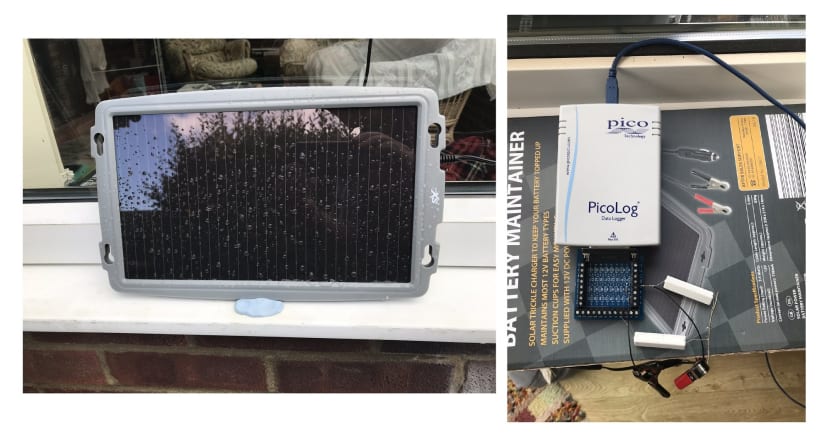
Next, I connect the solar panel leads to the load, which is connected to the terminal board, and the PicoLog 1012 and then to the laptop via a USB cable and I’m ready to run the PicoLog 6 software, which is free to download from www.picotech.com/downloads
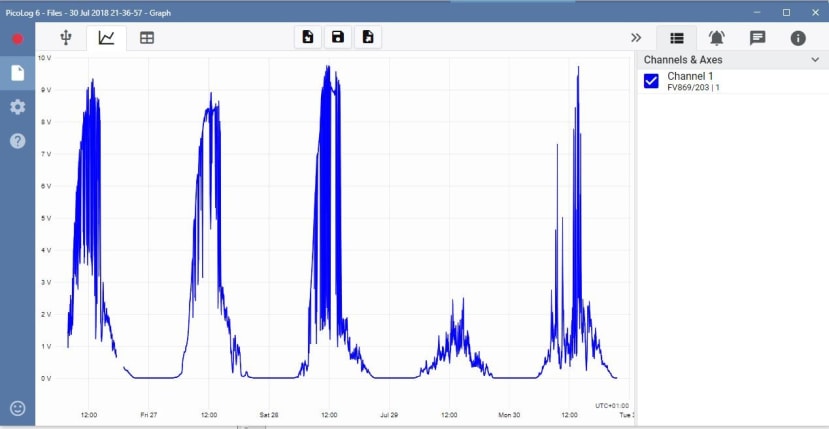
I actually ran the chart for 5 days. You can see the sunny days and the cloudy days particularly the rainy Sunday.
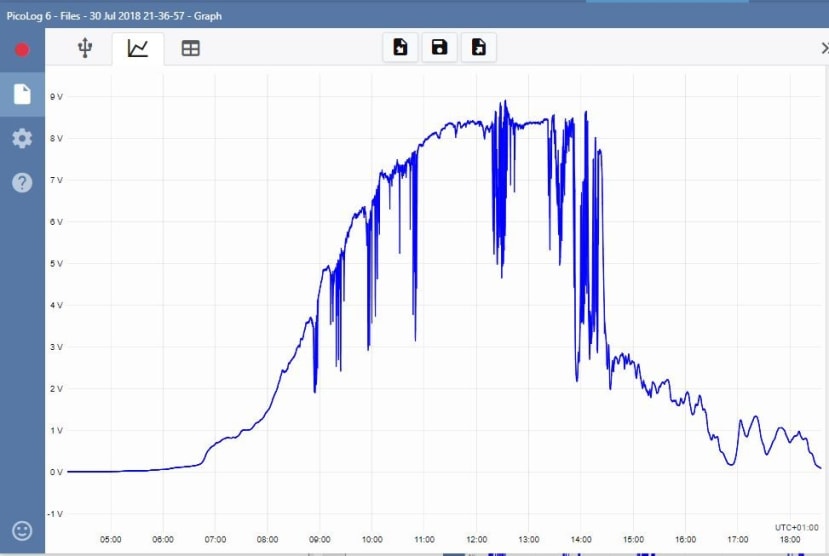
Zooming in on Day 2 shows it was mainly sunny with intermittent cloud.
It cuts off sharply around 3pm as the window falls into shadow.
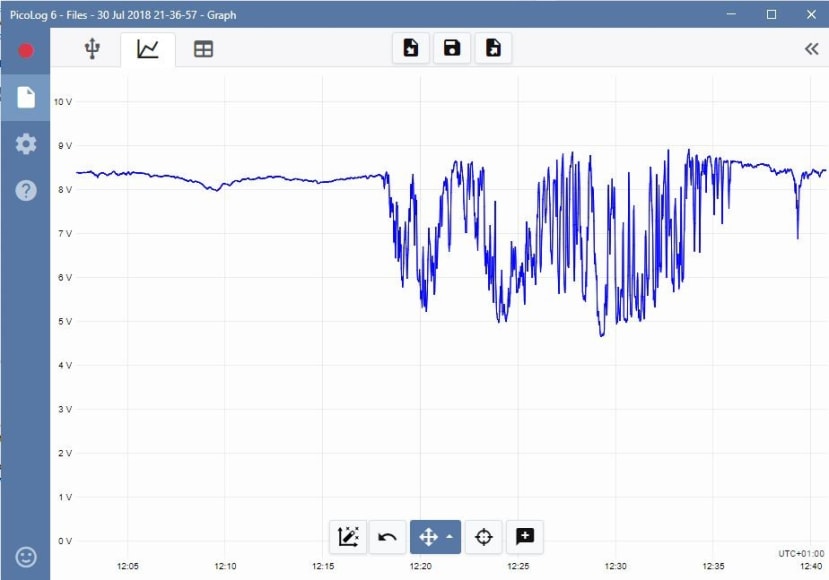
Zooming in further around midday it goes cloudy at about 12.17 then you get a feel for the changes in light until the cloud passes at 12.36
So that's all I set out to do but there is a lot more functionality with PicoLog 6 Software, Maths, Alarms, multiple channels, even multiple loggers, the range of parameters that can be monitored is endless.
Carl Bradbury - Pico Technology
For more information on Pico Dataloggers visit www.picotech.com/products/data-logger
See the range of loggers available from RS here.
Voltage Loggers
(668-4578) PicoLog 1000 Terminal Board
(666-8154) PicoLog 1012 with Small Terminal Board
(666-8163) PicoLog 1216 with Small Terminal Board
(536-8828) ADC 20 High-Resolution Data Logger + Terminal Board
(536-8834) ADC 24 High-Resolution Data Logger + Terminal Board
Other Loggers
(739-8607) PicoLog CM3 current logger with 3 clamps.
(492-5105) USB TC-08 Thermocouple data logger
(898-6823) USB TC-08 single-channel terminal board