Ahmsville: Interactive Air Quality Map
Follow articleHow do you feel about this article? Help us to provide better content for you.
Thank you! Your feedback has been received.
There was a problem submitting your feedback, please try again later.
What do you think of this article?
Hi there, I’m Ahmed Oyenuga a maker and entrepreneur based in Lagos, Nigeria. Building technology has always been an important part of my life, it empowers me to view my environment through its potential, and so I am passionate about using my skill to empower others in the same way. Below you will find out more about my project, which is one of many of the Air Quality Projects being created using the new Environmental Sensor Development Platform from DesignSpark.
See your environment in terms of air quality and plan healthier and safer outings.
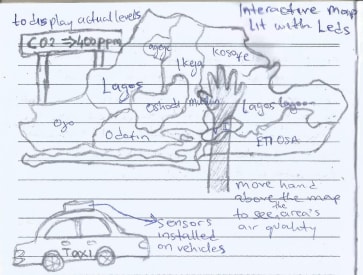
Similar to how you check Google Maps to find favourable routes, the interactive air quality map is a physical map that tells you the quality of the air at, and on the way to the locations that you’re heading to. Inspired by interactive art installations, the air quality map will show you in discrete led colours, the air quality data when you place your hands above or touch specific locations on the area represented by the map; helping you choose an air safe route to take or altogether discourage you from going to that location if the air quality is too bad.
Being a developing country, air quality in Nigeria may be seen as a low priority issue, but taking a closer look, you’ll find that it's yet another symptom of the larger problems plaguing the country. Poor air quality directly affects the health and wellbeing of us Nigerians and as such requires a lot more attention than is currently being paid to it.
Air pollution itself in Nigeria may not have a direct solution, but I do believe air quality data presented in a fun, engaging and far-reaching manner has the potential to begin inspiring investments in grander solutions to the larger problems that air pollution points to. A more detailed account of the air pollution problem in Lagos can be found in this article written by Karin Kemper and Shubham Chaudhuri.
My goal for the interactive air quality map is first: to raise awareness for the problem and provide people with the information they need to better protect themselves, and the second is to provide the people most directly affected by this poor air quality with an opportunity to campaign for temporary protective solutions and implore the people with the means and power to take responsibility for providing these solutions.
Design
Each of the locations represented on the map will feature a proximity sensor for detecting the interactions, and an array of individually addressable LEDs to show the air quality levels as colours.
The map can be built specific to a state/province, local area, estate or just your immediate environment like your home or work area, so it can be scaled according to the user’s requirements. As the actual sensor reading is done separate from the map, it can also be installed both indoors and outdoors. I personally plan on building the map for a specific area in, Lagos (not chosen yet) and deploying it outdoors as I believe Nigerians will appreciate being able to interact with their environment through a fun but informative medium.
The data used by the map will be collected from the main sensor array which will ideally be installed on vehicles (taxi or buses) that traverse as much of the areas covered by the interactive map as possible.
Similar Projects:
DIY Interactive LED Coffee Table by Creativity Hero: the display structure is an area map in this instance with the focus being air quality IoT data.
City Scanner by MiT sensible lab
BOM Estimated (EXCL Shipping):
- ESP32 Development Board $3.7
- infrared sensors $2.97 (x?)
- Addressable LEDs $17.78
- 128*64 DOTS LCD Module 6.6$
- 3d filament, metalwork and miscellaneous $100
Total = $131.05
Estimated time (depending on how much work I get done before receiving the sensor kit): 2 - 3 weeks.


Comments