Home monitor with Rock 4C+: Part 3 - The real thing
Artikel folgen Dave von DesignSpark
Wie finden Sie diesen Artikel? Helfen Sie uns, bessere Inhalte für Sie bereitzustellen.
Dave von DesignSpark
Vielen Dank! Ihr Feedback ist eingegangen.
Dave von DesignSpark
There was a problem submitting your feedback, please try again later.
Dave von DesignSpark
Was denken Sie über diesen Artikel?
In the first two parts of the home monitor series built around a Rock 4C+ (230-6199) we have set the basics (installing and configuring the operating system and necessary applications), testing the software and we got introduced to MQTT and Node-RED as building blocks for a more complex system.
In this last article, we will describe a home monitoring system that gets data from several sources:
- A solar system that by day charges a battery and by night uses its energy to power a projector that lights my house entrance; we monitor the energy produced and what is consumed, and also the voltage of the battery
- The temperature and humidity outdoors
- The temperature and humidity indoors
- The temperature of a heating system that burns wood
Data sources and general schema
Here is a very general view of the system, with data sources laid on the top:

The solar system is a standard setup: a 100W solar panel connected to a PWM solar controller that charges a 12V battery, and also controls the output onto the load (a small 12V to 220V converter that powers an LED projector). Inserted into the power path to the battery is a pair of shunts (10A/ 75mV) that are measured by an ESP8266 and an ADS1115 analog to digital converter (it has 4 channels, two are connected to the shunts and a third to the battery through a voltage divider). Note that the ground of the ADS1115 is between the two shunts, so when the current flows from the solar panel to charge the battery there will be voltage on the bottom shunt, and when the current flows from the battery to the load there will be voltage on the upper shunt.
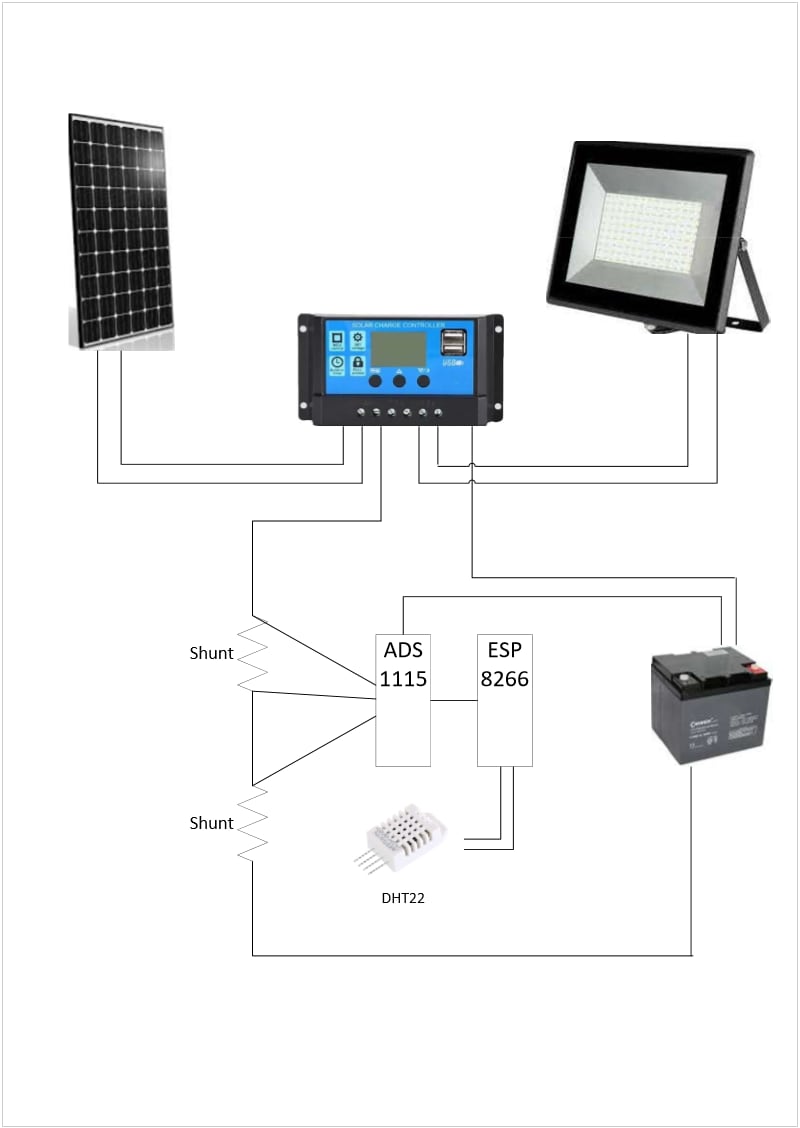
As you can see, the outdoor weather system is integrated with the solar system by connecting a temperature and humidity sensor DHT22 to the ESP8266.
The indoor system is based on an ESP8266 connected to a temperature and humidity sensor DHT22, pretty much similar in configuration to the device we used in part 2 of this series in the "Step 1 - Get some data" chapter.
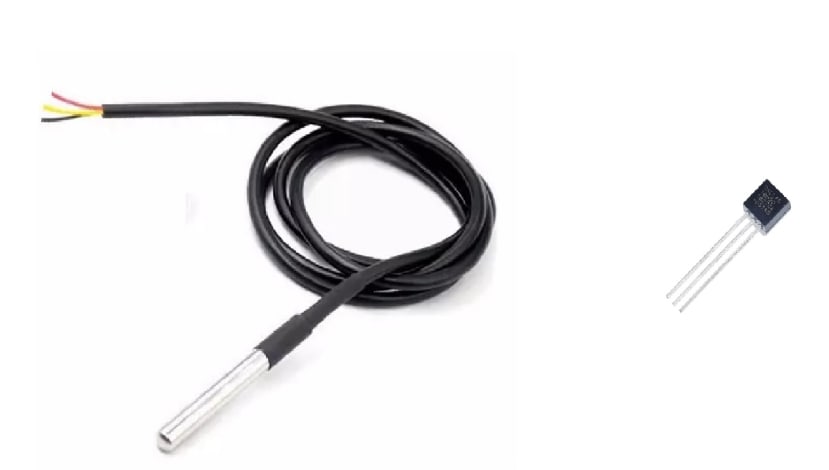
The heating unit data source is also built around ESP8266, but it has two Dallas DS18B02 temperature sensors. The first one is cylindrical and is attached to the back of the boiler, in close contact with the exhaust hot water pipe, and fits into a jacket for better thermal conduction. Below is a picture of the sensor with the two different cases used in this project.
The second Dallas DS18B02 temperature sensor is used to monitor the ambient of the ESP module (in my early tests I was concerned that the temperature of the module itself will rise by a few degrees and I wanted to monitor that, but later it proved that this is not a concern). Below is a detailed schema of this module.

Data transformation needed
The first three modules run ESPEasy (https://www.letscontrolit.com/wiki/index.php/ESPEasy) on the ESP8266. ESPEasy is similar to Tasmota in its functionality (it provides a large range of sensors that can be connected and data sent through MQTT, can do local automation through rules and be updated over the air). However, the data sent to the MQTT has a much simpler format aligned to the topic philosophy of MQTT - in the form of /system_name/task/device_value which makes it very easy to be interpreted by any visualization system.
But the heating unit runs Tasmota which provides much complex and richer messages in MQTT. So to reconcile those two systems we need to either process them differently or to agree on a common denominator and transform Tasmota messages to become simpler, as we have done in part 2 of this series in the "Step 2 - Process data" chapter.
So the technique is to extract data provided by Tasmota in MQTT, extract the desired values (temperatures from the two sensors, uptime, etc) and re-inject them in MQTT in the form /system/task/value similar to the data provided by the devices that run ESPEasy. This can be done using a Node-RED flow similar to the one in the previous article.
Data visualization
Now we have all the data we need to be displayed in a unified form and provided through MQTT with topics like /system/task/value. As we have seen in the previous article we can use Node-RED to create webpages that display this data in rich controls such as gauges, graphs, tables and so on. But my choice was to leverage the richness of another system called Home Assistant (https://www.home-assistant.io/), and to avoid the complexity of installation we will install it as a snap:
sudo apt update
sudo apt upgrade
sudo snap install home-assistant-snap
Once installed, Home Assistant is accessible in the browser at https://your_Rock_name_or_IP:8123. The first connection will ask you to provide user details, location of this installation on the map, data collection allowed and will ask to accept existing integrations.

Before starting to configure the Home Assistant it is advisable to enable the advanced feature: in the left bar on the bottom click on the user you created and slide "Advanced Mode", logoff and logon again.
First step in configuring Home Assistant is to enable it to read and understand data from the MQTT server. First, verify the configuration file and then change it:
sudo more /var/snap/home-assistant-snap/current/configuration.yaml
sudo nano /var/snap/home-assistant-snap/current/configuration.yaml
And by adding at the end (this is a sample for the data in my particular system):
mqtt:
  sensor:
    - name: VborneBat
      unique_id: "VborneBat"
      state_topic: "/VDsolar/ADSvoltage3/VborneBat"
      unit_of_measurement: "V"
    - name: "IinBat"
      unique_id: "IinBat"
      state_topic: "/VDsolar/IBatInOut/IinBat"
      unit_of_measurement: "A"
    - name: "IoutBat"
      unique_id: "IoutBat"
      state_topic: "/VDsolar/IBatInOut/IoutBat"
      unit_of_measurement: "A"
    - name: "VDsolarTemp"
      unique_id: "VDsolarTemp"
      state_topic: "/VDsolar/DHT/Temperature"
    - name: "VDsolarHumid"
      unique_id: "VDsolarHumid"
      state_topic: "/VDsolar/DHT/Humidity"
      unit_of_measurement: "%"
    - name: "VDboilerTemp"
      unique_id: "VDboilerTemp"
      state_topic: "/VDboiler/BoilerTemp/Temperature"
    - name: "VDboilerSysTemp"
      unique_id: "VDboilerSysTemp"
      state_topic: "/VDboiler/BoilerSysTemp/BoilerSysTemp"
    - name: "VDboilerUptime"
      unique_id: "VDboilerUptime"
      state_topic: "/VDboiler/BoilerUptime/uptime"
      unit_of_measurement: "second"
    - name: "DormSudTemp"
      unique_id: "DormSudTemp"
      state_topic: "/VDdormSud/Dallas/DallasTemp"
    - name: "DormSudHumid"
      unique_id: "DormSudHumid"
      state_topic: "/VDdormSud/DHT/DHThumid"
This tells Home Assistant that the first sensor is named "VborneBat" (the voltage of the battery in the solar system) and values can be obtained from MQTT server by subscribing to the topic "/VDsolar/ADSvoltage3/VborneBat" (VDsolar is the name of the ESP8266 unit, whose sensor is ADSvoltage3 and that provides the measurement for the battery voltage) and interpreted as units of Voltage (V). The same applies in order for: the current in and out of the battery, outside temperature and humidity, the two temperatures provided by the heating system - the boiler and inside the case of the ESP8266, and the temperature and humidity inside the house - the sensor is located in the Southern dormitory, hence the name VDdormSud.
Before using these parameters, we must be sure that the syntax is correct and will not stop Home Assistant from booting. To do this we must access the Developer Tools menu, click on the YAML tab, click on "Check configuration" and make sure the answer is green, then click on Restart HA (or simply restart the whole snap):

We still need to add and configure the connection to the MQTT server. Click on Settings, then on "Devices and Services", then on Integrations and add new MQTT integration (the blue button on the right downside of the screen). You will need to enter the name or address of the MQTT server and accept all other defaults.
To check that MQTT integration works as expected you can verify that new entities are accessible by clicking Settings, then "Devices and Services", then Entities - which should start to be populated with the entities we described in the configuration file:

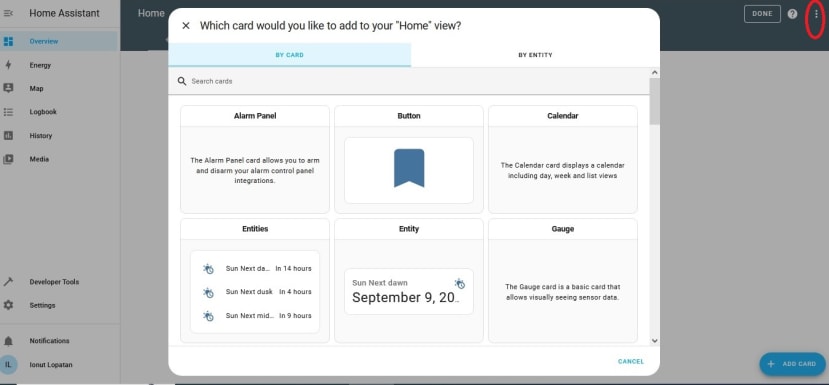
And now comes the fun part: configure the dashboard to display all this data. To do this you need to edit the default dashboard (P.S. You can create new dashboards and make them accessible only to specific users). Click on the Overview dashboard, then on the ellipsis on the upper right and click on "Edit Dashboard", and accept to take over the default dashboard.
For example you can now click on "Add card" and select Gauge to add it to the dashboard:
Now configure the gauge and add some spice by turning severity on and defining thresholds that will colour the gauge:
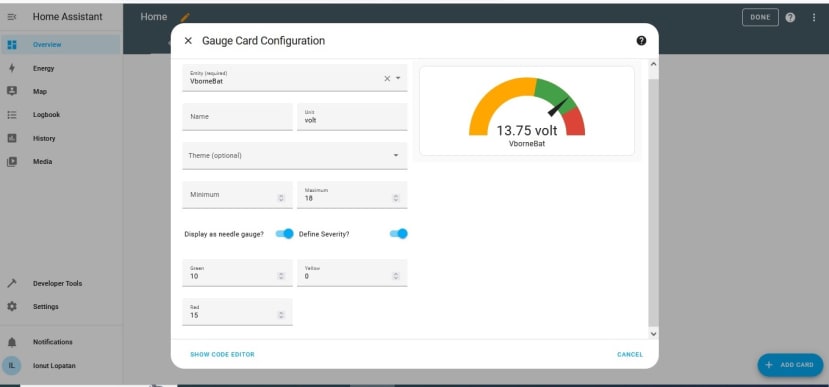
Note that for the first time, you may get an error message stating the entity is not numeric, but it will be ok once some data is published into the MQTT server.
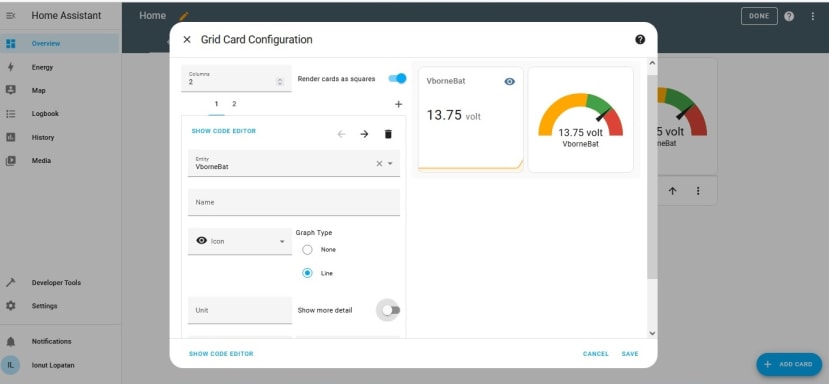
There is a large palette of cards you can use to display data. A grid card lets you group several cards into one entity so they display together:
Besides MQTT, you can add other integrations that get data from external sources; some of my favourite integrations are:
- meteo forecast from Norwegian Meteorological Institute at http://met.no (it is populated by default in the original snap)
- speedtest is used to test my Internet connection and to measure download and upload speeds and ping time
- status of my HP Laser printer (which displays the percentage left in the toner and drum cartridges); this integration will be detected automatically once you connect your printer to the local network and then you can simply add it to your data sources
Below is an example of a fully configured dashboard using Home Assistant:

Mobile view
Home Assistant has also an application for mobile phones. Besides visualization of information, you can also do most of the dashboard configuration tasks. Here is the Android version of this application that was downloaded from Google store:

In the end let's note that this home monitoring system can be expanded further, and one way is by adding the necessary flows in Node-RED. For example, we can correlate the inside temperature with the boiler temperature, and by installing a mechanism to control the airflow in the boiler we will be able to trim the inside temperature to a specific value (the temperature of the hot water in the boiler that will heat the indoors is proportional to the airflow that helps burning the wood inside the boiler).
Kommentare