VitaLink: Bridging Critical Healthcare Beyond Boundaries
Follow project
 Dave from DesignSpark
How do you feel about this article? Help us to provide better content for you.
Dave from DesignSpark
Thank you! Your feedback has been received.
Dave from DesignSpark
There was a problem submitting your feedback, please try again later.
Dave from DesignSpark
What do you think of this article?
 VitaLink, our internet-connected patient monitor powered by STM32F429ZI and W5300 module empowers global access to real-time vital signs, enabling timely interventions, informed decision-making, and collaborative care for improved patient outcomes.
Parts list
| Qty | Product | Part number | |
|---|---|---|---|
| 1 | STMicroelectronics STM32 Nucleo-144 MCU Development Board NUCLEO-F429ZI | 917-3775 | |
| 1 | W5300-TOE-Shield | ||
| 1 | MAX30102 PPG Heart Rate and Oximeter Sensor | ||
| 1 | Analog Heart Rate Monitor Sensor (ECG) | ||
| 1 | Seeed Studio Seeed XIAO BLE nRF52840 Sense, Arduino Compatible Board | 250-0968 | |
| 1 | RS PRO 12W Plug-In AC/DC Adapter 12V dc Output, 1A Output | 206-4916 | |
| 1 | DC Power Jack Female Adapter | ||
| 1 | RS PRO Single Sided Matrix Board FR2 1.02mm Holes, 2.54 x 2.54mm Pitch, 160 x 100 x 1.6mm | 100-4334 | |
| 1 | RS PRO Black 0.5 mm² Hook Up Wire, 20 AWG, 16/0.2 mm, 25m, Silicone Rubber Insulation | 248-3619 | |
Introduction
In the field of medical technology, advancements have been relentless in their pursuit of enhancing patient care. With the rise of telemedicine, artificial intelligence (AI), and robotic surgeries, the healthcare landscape has experienced groundbreaking transformations. In this context, the development of an internet-connected patient monitor holds immense potential to revolutionize critical care units, enabling remote access to real-time vital signs and empowering doctors to make crucial decisions regardless of their physical location.
Current Landscape and Limitations
Critical care units are the cornerstone of medical intervention for severely ill patients. Patient monitoring devices have played a pivotal role in these units, providing healthcare professionals with real-time data on vital signs such as electrocardiogram (ECG), heart rate (BPM), blood oxygen saturation (SPO2), and temperature. These devices are essential in diagnosing critical conditions, enabling timely interventions, and ensuring patient safety.
However, the limitation lies in the restricted accessibility of these vital signs data. The attending physician's location can create barriers to making informed decisions swiftly. In scenarios where an expert doctor is not on-site, or perhaps even in a different country, the traditional patient monitors fall short of providing the necessary data for timely interventions. This limitation can lead to delays in diagnosis, and treatment, and ultimately impact patient outcomes.
The Innovative Solution: Internet-Connected Patient Monitor
Enter the universe of futuristic medical technology: an internet-connected patient monitor designed to bridge the gap between critical care units and remote medical expertise. This groundbreaking solution leverages cutting-edge components, including the STM32F429ZI microcontroller and W5300 module, to create a seamless connection between patient vitals and medical practitioners anywhere in the world.
Technical Breakdown
The heart of this innovative system is the STM32F429ZI microcontroller, which serves as the central processing unit for collecting and processing patient vital signs. The W5300 module provides crucial internet connectivity, enabling data transmission to a secure cloud-based visualization dashboard. This dashboard becomes the window through which authorized medical personnel can access real-time patient data, transforming raw numerical and waveform data into easily comprehensible visualizations.
The device continuously gathers vital signs, including ECG, BPM, SPO2, and temperature, and transmits this data to the visualization dashboard via the Internet. This remote access is secured through robust encryption protocols, ensuring patient privacy and compliance with healthcare regulations.
Revolutionizing Critical Care
The implications of this internet-connected patient monitor are far-reaching. It addresses the current limitations by offering an immediate solution to bridge the geographical gap between patients and doctors. Here are some key advantages:
- Global Access: Medical professionals can access patient vital signs from anywhere in the world, allowing for timely interventions and consultations irrespective of their physical location.
- Timely Decision-Making: By providing real-time data visualization, doctors can make informed decisions promptly, minimizing the risk of delays and optimizing patient outcomes.
- Collaborative Care: Experts from various fields can collaborate seamlessly, contributing their insights and recommendations for complex cases without the need for physical presence.
- Resource Optimization: Remote monitoring reduces the need for constant on-site attendance, allowing medical professionals to allocate their time and expertise more efficiently.
Demo Video
How Does VitaLink Work
We have developed an advanced system that serves as an internet-connected patient monitor. The core components include an STM32F429ZI microcontroller and a W5300 module, which together form the central hub of the device. Attached to the STM32F429ZI are various sensors like a SpO2 sensor, temperature sensor, and ECG sensor, all aimed at tracking crucial patient metrics. Additionally, there's a finger probe equipped with a Xiao NRF Sense running a TinyML model. This probe monitors patient movements and can promptly identify anomalous behaviours, such as seizures. It also functions as a means for patients to call for nursing assistance.
The entire setup operates on a real-time operating system (RTOS), facilitating seamless coordination between different sensors and the finger probe. The highly efficient W5300 acts as the conduit between this system and a dashboard, enabling immediate visualization and continuous monitoring of vital signs. This becomes exceptionally valuable in critical situations and during periods when medical professionals aren't physically present.
Notably, the system includes an alert mechanism triggered by rapid fluctuations in vital sign readings that could indicate potential medical complications. When these readings surpass predetermined thresholds, the system promptly notifies doctors and nurses. Furthermore, it's designed to detect seizures or irregular movements. In such instances, or when a patient signals for nurse assistance, an alert is sent directly to the nurse.
The impact of this system on critical healthcare is immense. It ensures continuous and real-time monitoring of patients' vital signs, offering an extra layer of care, especially when medical staff might not be immediately available. Its ability to detect anomalies, signal for help, and provide timely alerts can significantly enhance patient safety and outcomes, particularly in high-risk scenarios.
The Brain
The Brain of the system is composed of STM32 Nucleo 144 F429ZI and the W5300 TOE shield. The W5300 TOE Shield and STM32 Nucleo-144 F429ZI microcontroller are pivotal elements that collectively empower the Telemedicine IoT project with its capabilities. Now, let's observe how it functions in action.
1. W5300 TOE Shield
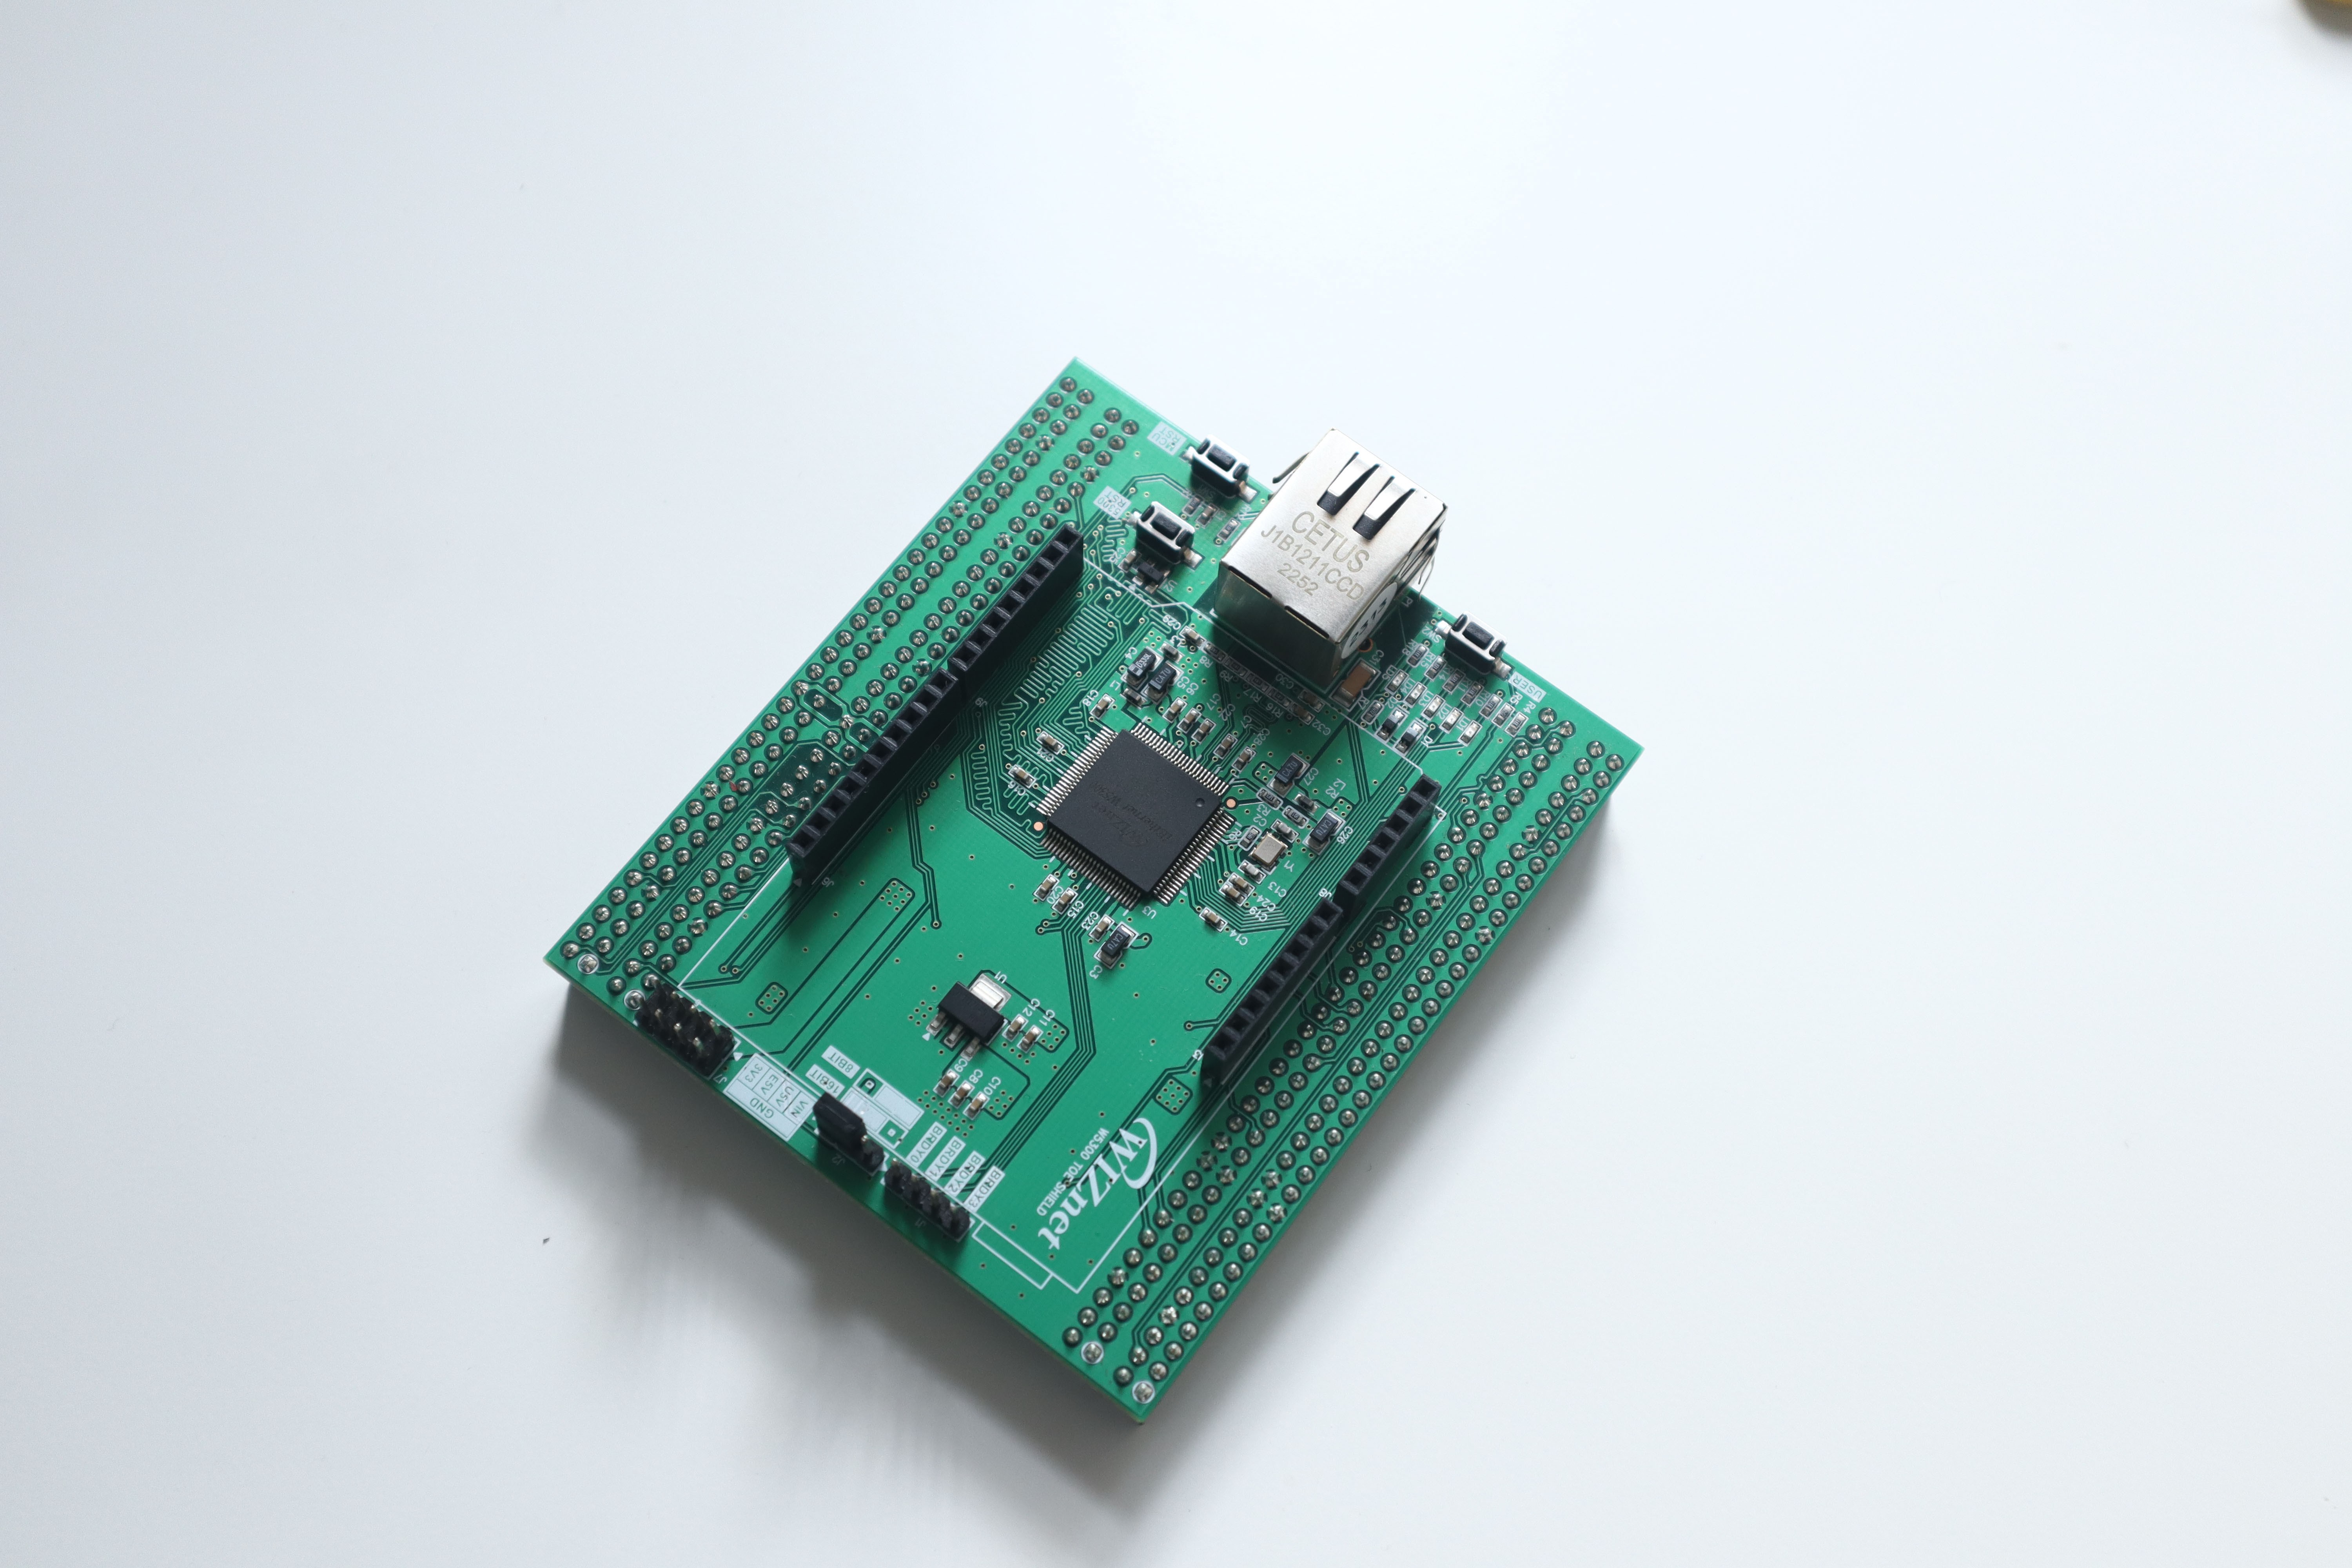
The W5300 TOE Shield stands as a cornerstone in the Telemedicine IoT project's architecture, providing the critical functionality of TCP/IP communication. This shield extends beyond traditional network controllers by implementing a specialized TCP/IP Offload Engine, presenting a paradigm shift in data transmission and communication.
What is TCP/IP Offload Engine
The TCP/IP Offload Engine is a hardware-based mechanism that delegates the complex task of managing TCP/IP protocol stacks from the main microcontroller to dedicated hardware. It unburdens the microcontroller from intricate networking operations, freeing it to focus on core responsibilities, such as data acquisition, processing, and interfacing.
Features and Capabilities
- Hardware TCP/IP Stack Processing: The hardware-based TCP/IP stack processing drastically reduces the microcontroller's workload, optimizing its performance. This results in reduced latency, efficient data management, and improved real-time responsiveness.
- Efficient Data Transmission: By managing the TCP/IP stack, the W5300 TOE Shield ensures smooth and reliable data transmission. It handles tasks such as data segmentation, reassembly, and error handling, guaranteeing data integrity and minimizing overhead.
Importance In This Project
- Reduced Microcontroller Workload: In the context of the Telemedicine IoT project, the W5300 TOE Shield plays a pivotal role in offloading the burden of TCP/IP protocol handling from the STM32 Nucleo microcontroller. This separation of concerns enhances the microcontroller's efficiency, allowing it to allocate resources to critical patient data processing and real-time monitoring.
- Bandwidth Optimization: Efficient utilization of bandwidth is paramount when transmitting real-time patient data. The W5300 TOE Shield optimizes bandwidth consumption by effectively managing data packets, enabling uninterrupted and reliable data transmission from the STM32 Nucleo to the cloud.
- Reliable Real-Time Data Transmission: The W5300 TOE Shield's reliable hardware-driven TCP/IP stack ensures the integrity of data transmission. In a telemedicine scenario, where accurate and timely data delivery is crucial, this feature guarantees that patient vitals are accurately conveyed to the web dashboard without delays or data loss.
2. STM32 Nucelo-144 F429ZI
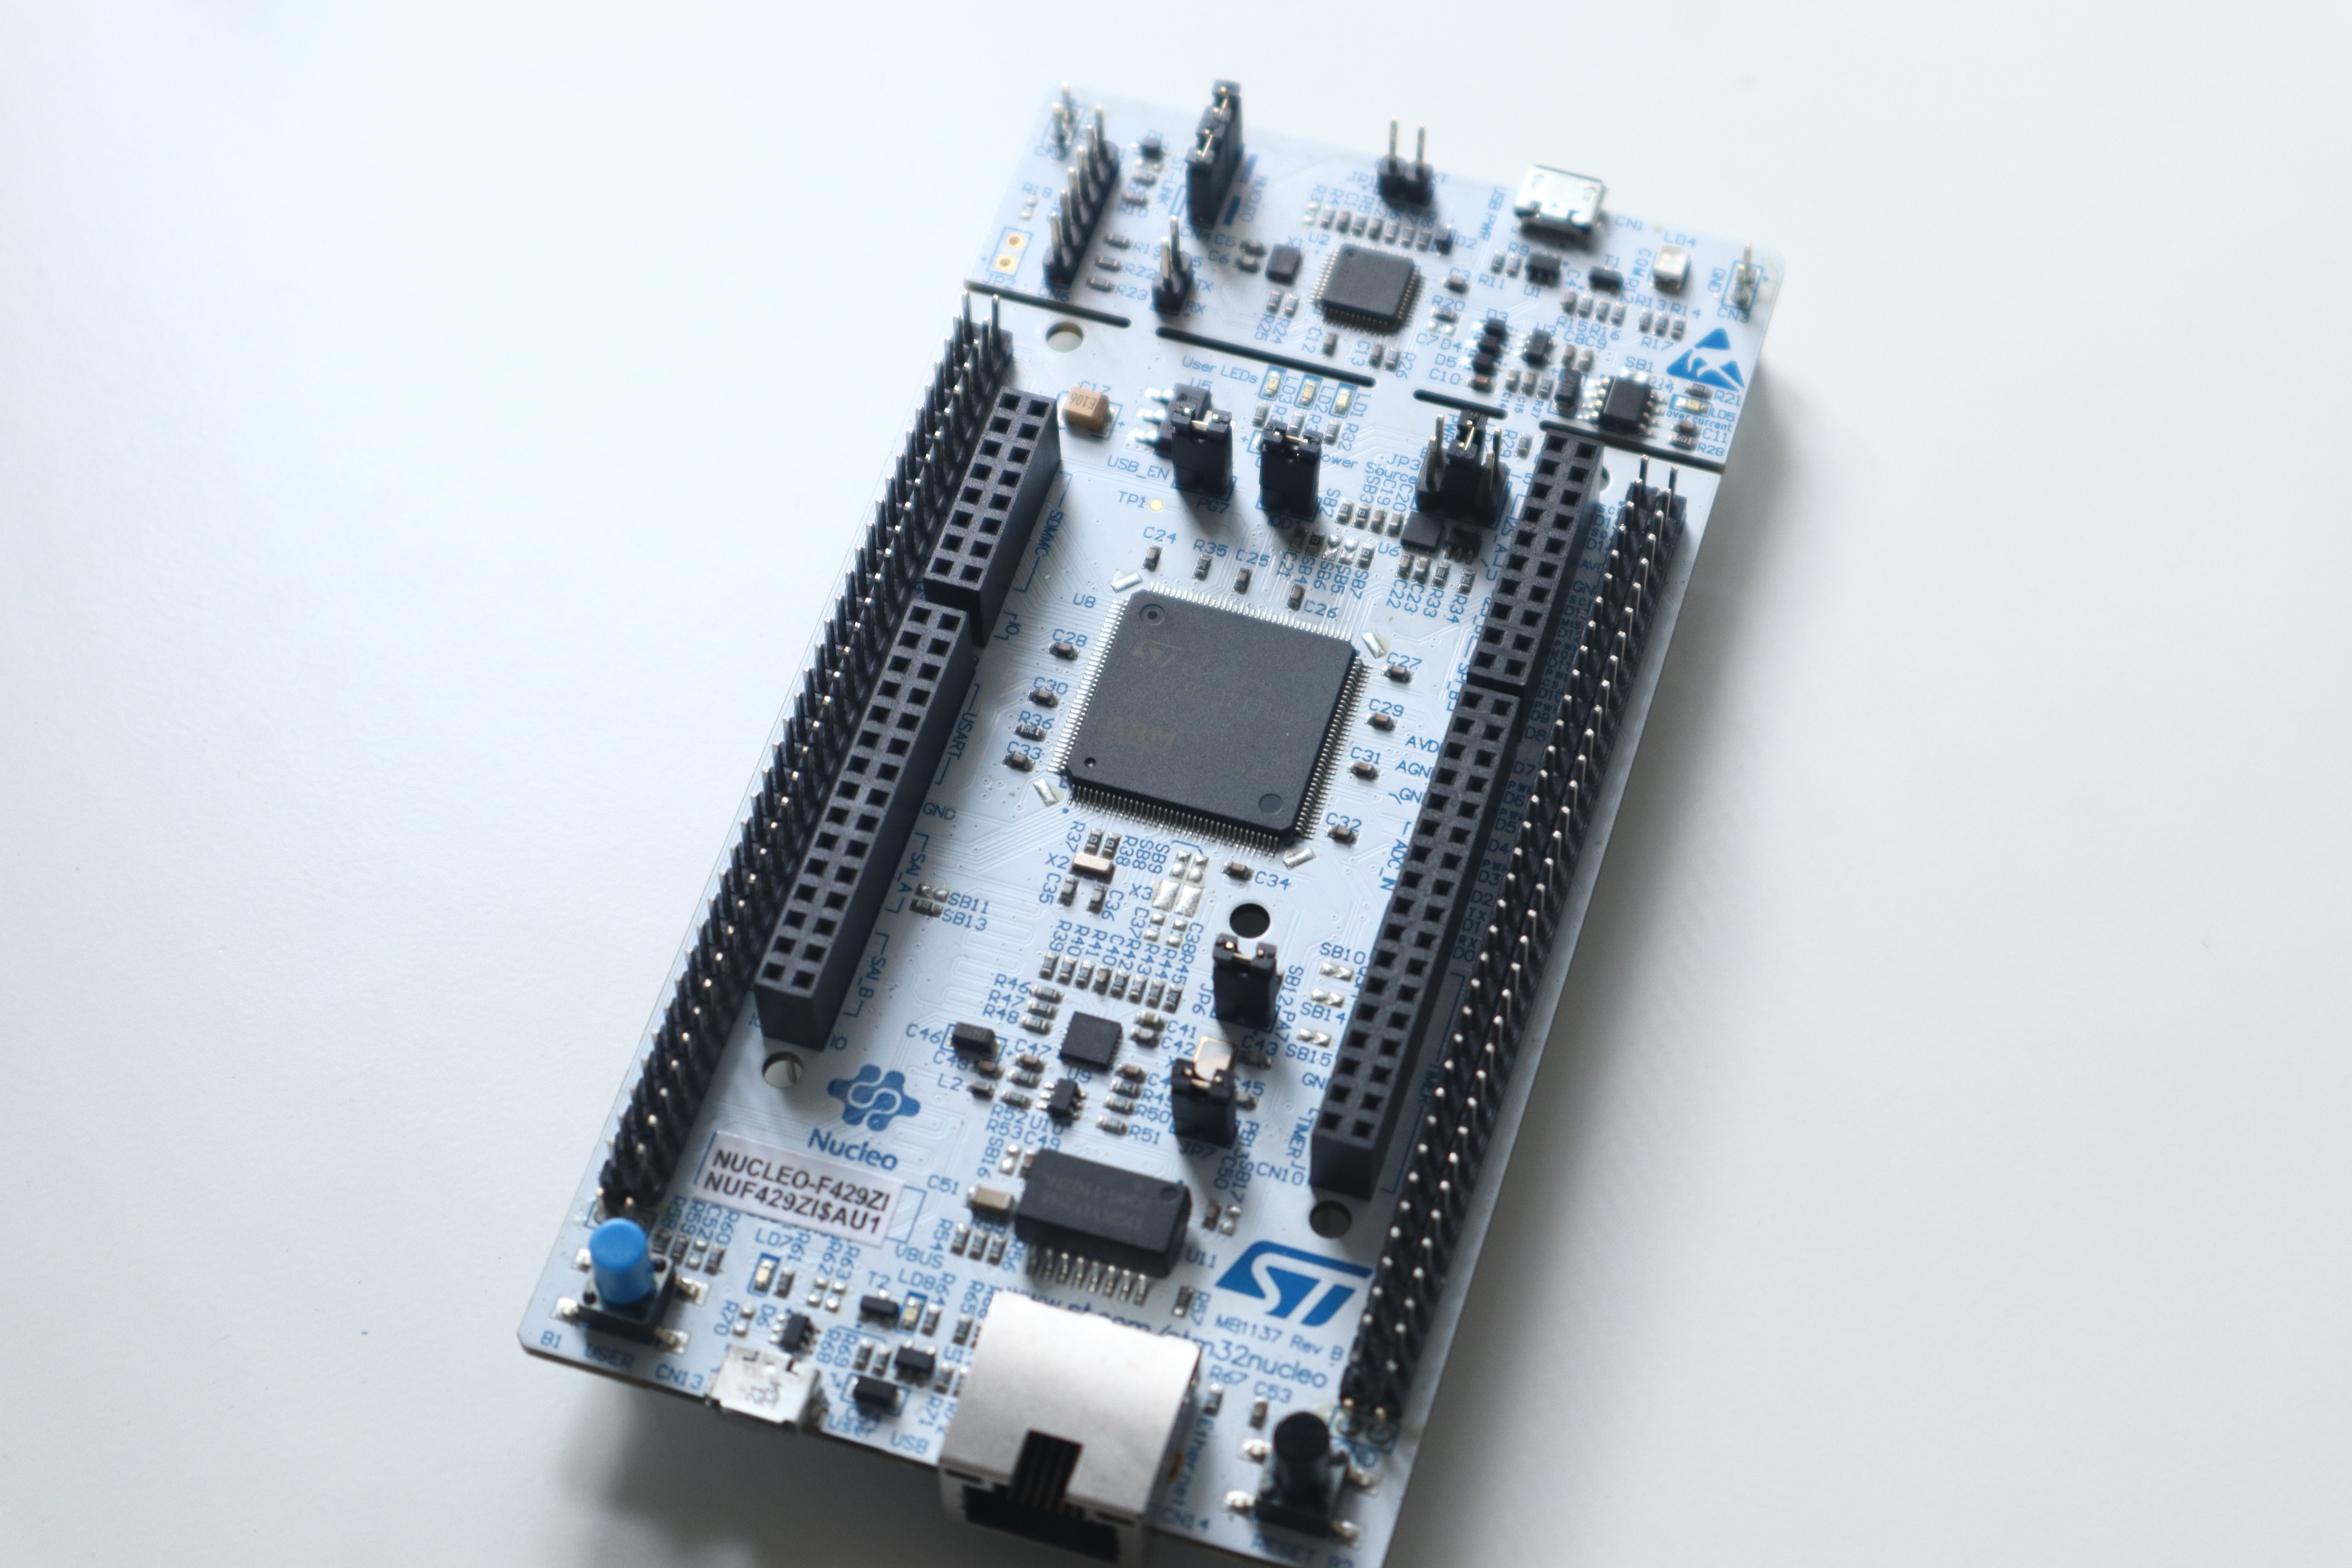
The STM32 Nucleo-144 F429ZI microcontroller is a powerhouse that underpins the Telemedicine IoT project's data processing and sensor integration. Here are some technical points about the STM32 Nucleo-144 F429ZI that are relevant and can be utilized in this Telemedicine IoT project
- Microcontroller Power: The STM32 Nucleo-144 F429ZI is powered by an ARM Cortex-M4 core with FPU, providing ample processing power for real-time data processing and analysis
- Analog-to-Digital Converter (ADC): The built-in ADC allows for precise analog data conversion, enabling accurate capture of sensor readings from the SPO2 and ECG sensors.
- Digital Signal Processing (DSP): The Cortex-M4's DSP capabilities can be harnessed to perform real-time signal processing on ECG waveforms, enhancing the accuracy of heart rhythm analysis.
- GPIO Pins: The numerous GPIO pins provide flexibility for interfacing with various sensors, LEDs, and other components.
- Communication Interfaces: Utilize communication interfaces such as UART, SPI, and I2C to interface with the W5300 TOE Shield and sensors. SPI could be used to interface with the TOE Shield for efficient data exchange
- FreeRTOS Support: The STM32 Nucleo platform supports the FreeRTOS real-time operating system, which can enhance multitasking and real-time data processing capabilities.
- Flash Memory: The microcontroller's Flash memory can store firmware, configuration data, and calibration parameters for sensors, ensuring reliable operation across power cycles.
- Floating-Point Unit (FPU): Utilize the FPU for efficient floating-point arithmetic, enabling accurate calculations in real-time sensor data analysis.
- Development Environment: The STM32 Nucleo board is supported by both STM32Cube software and Arduino IDE
- Debugging Tools: Leverage built-in debugging tools like ST-Link for real-time debugging and performance analysis, enabling efficient troubleshooting during development.
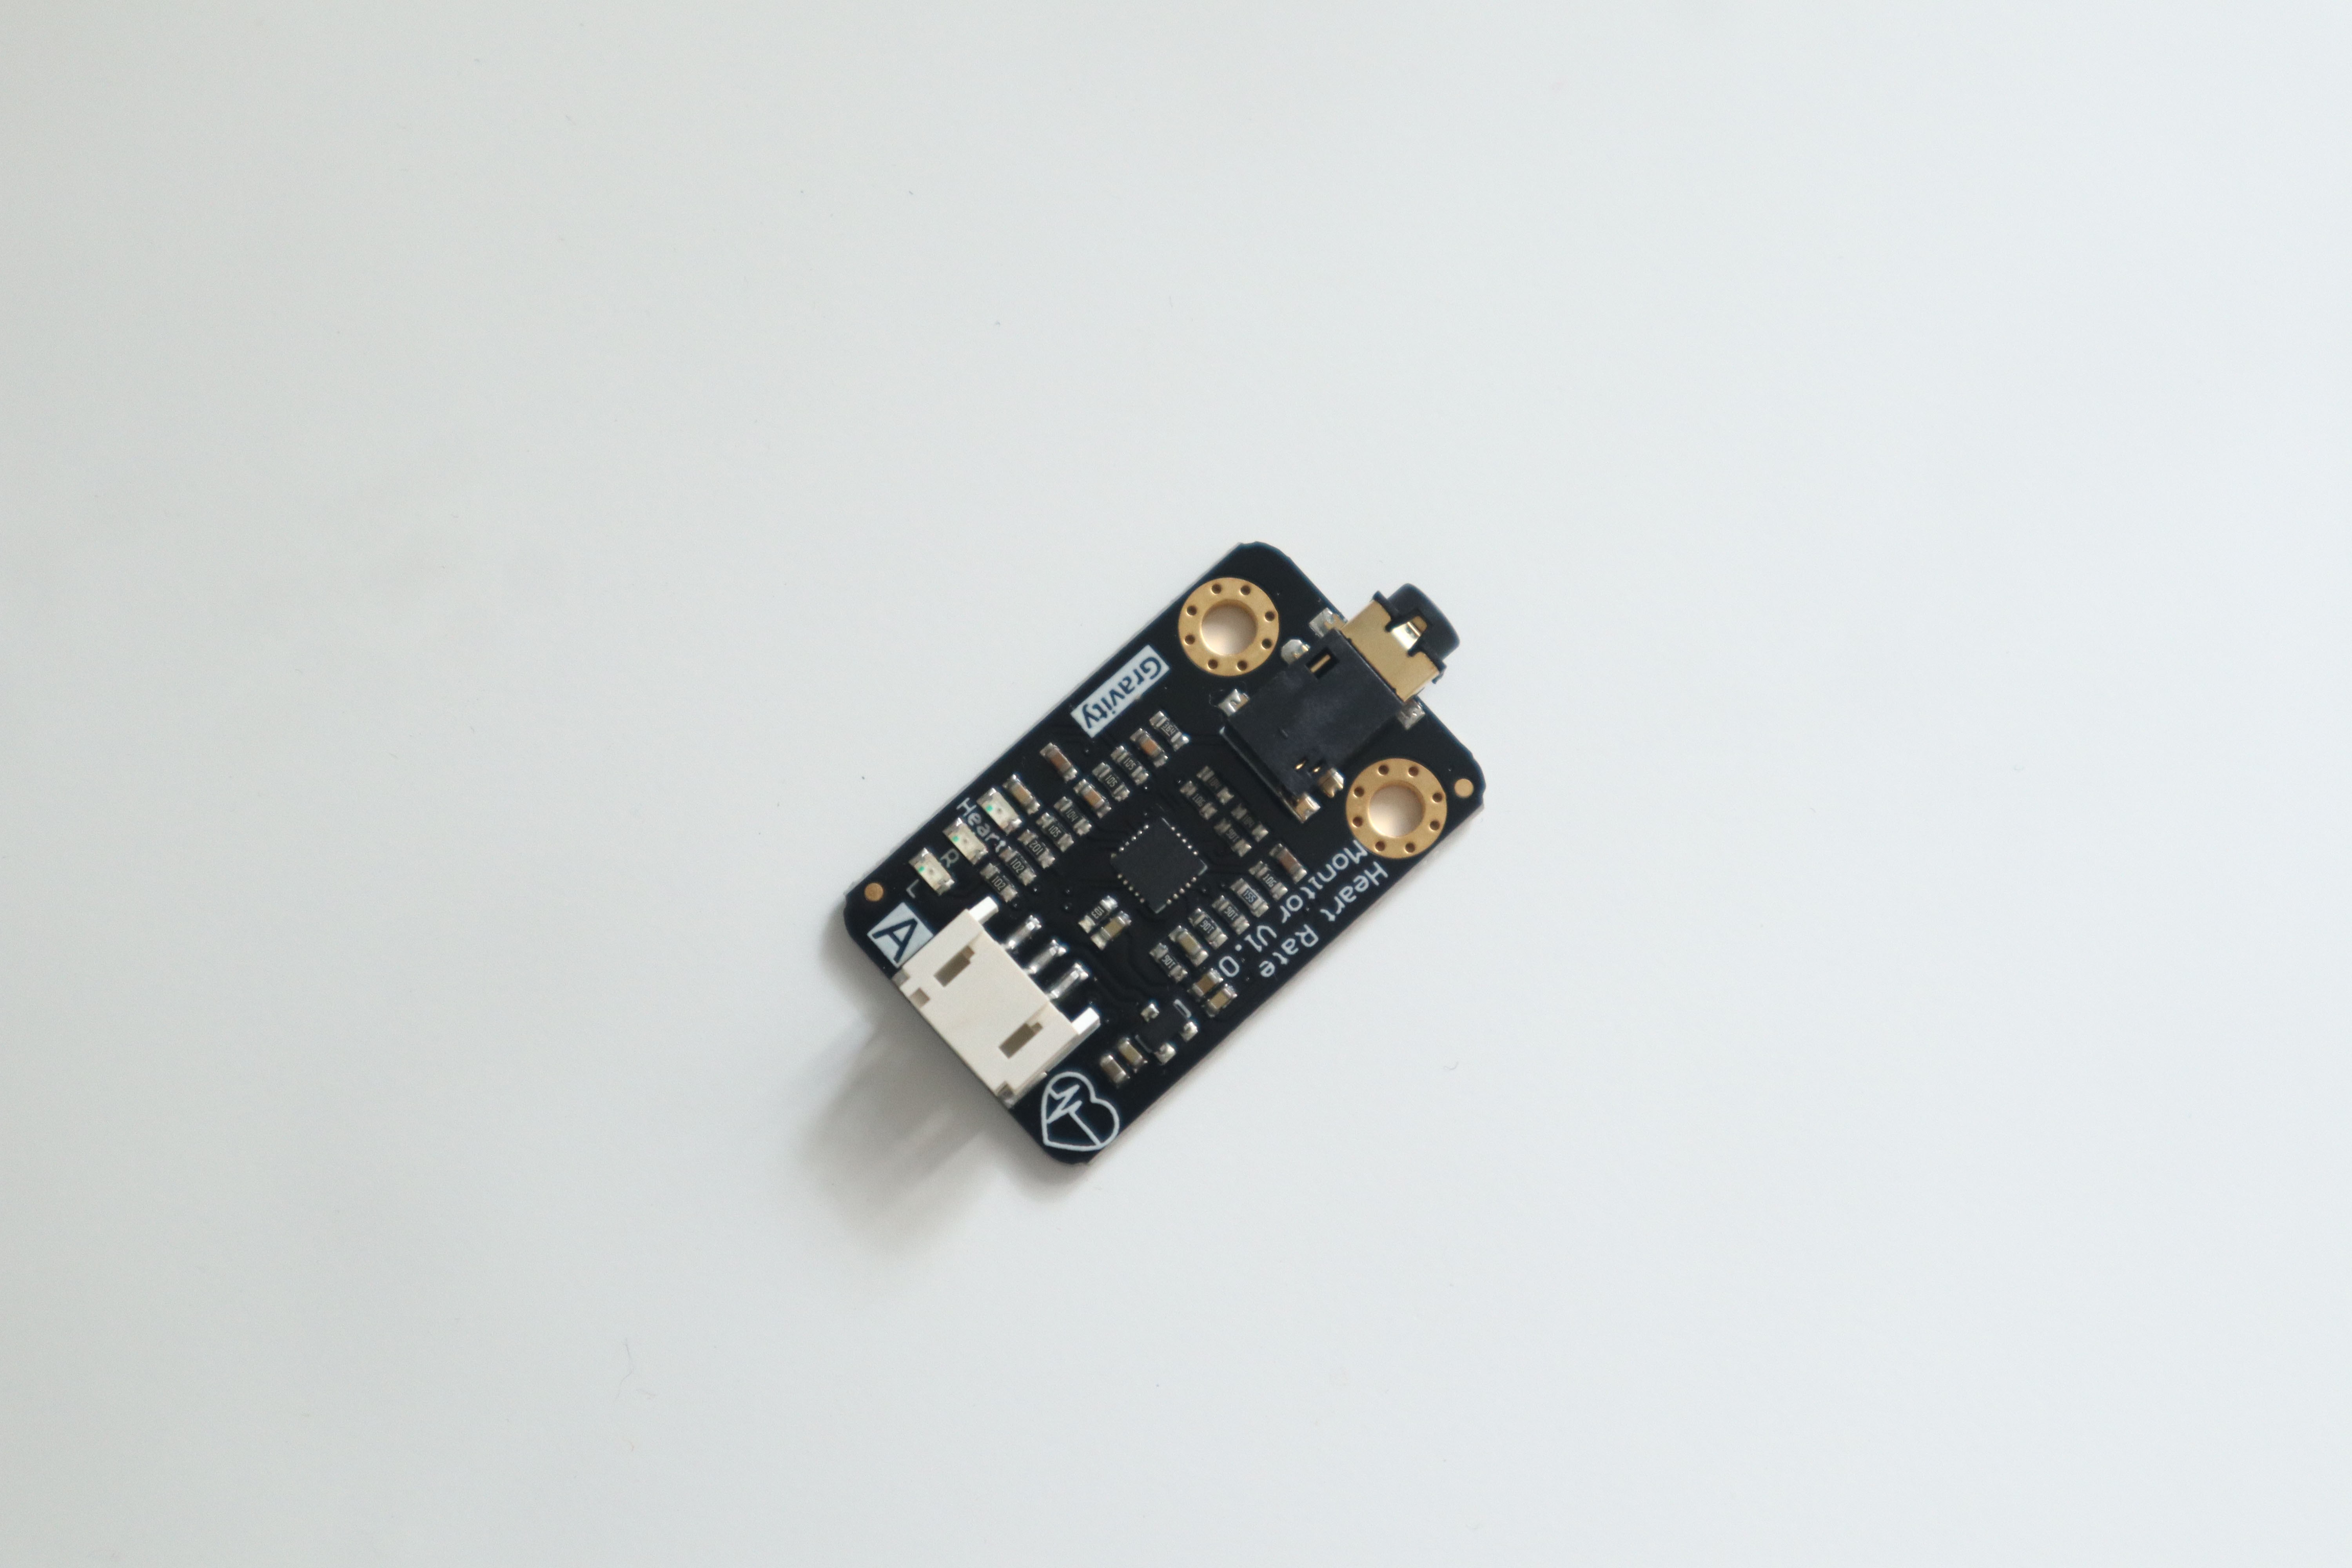
3. MAX30102 PPG Heart Rate and Oximeter Sensor
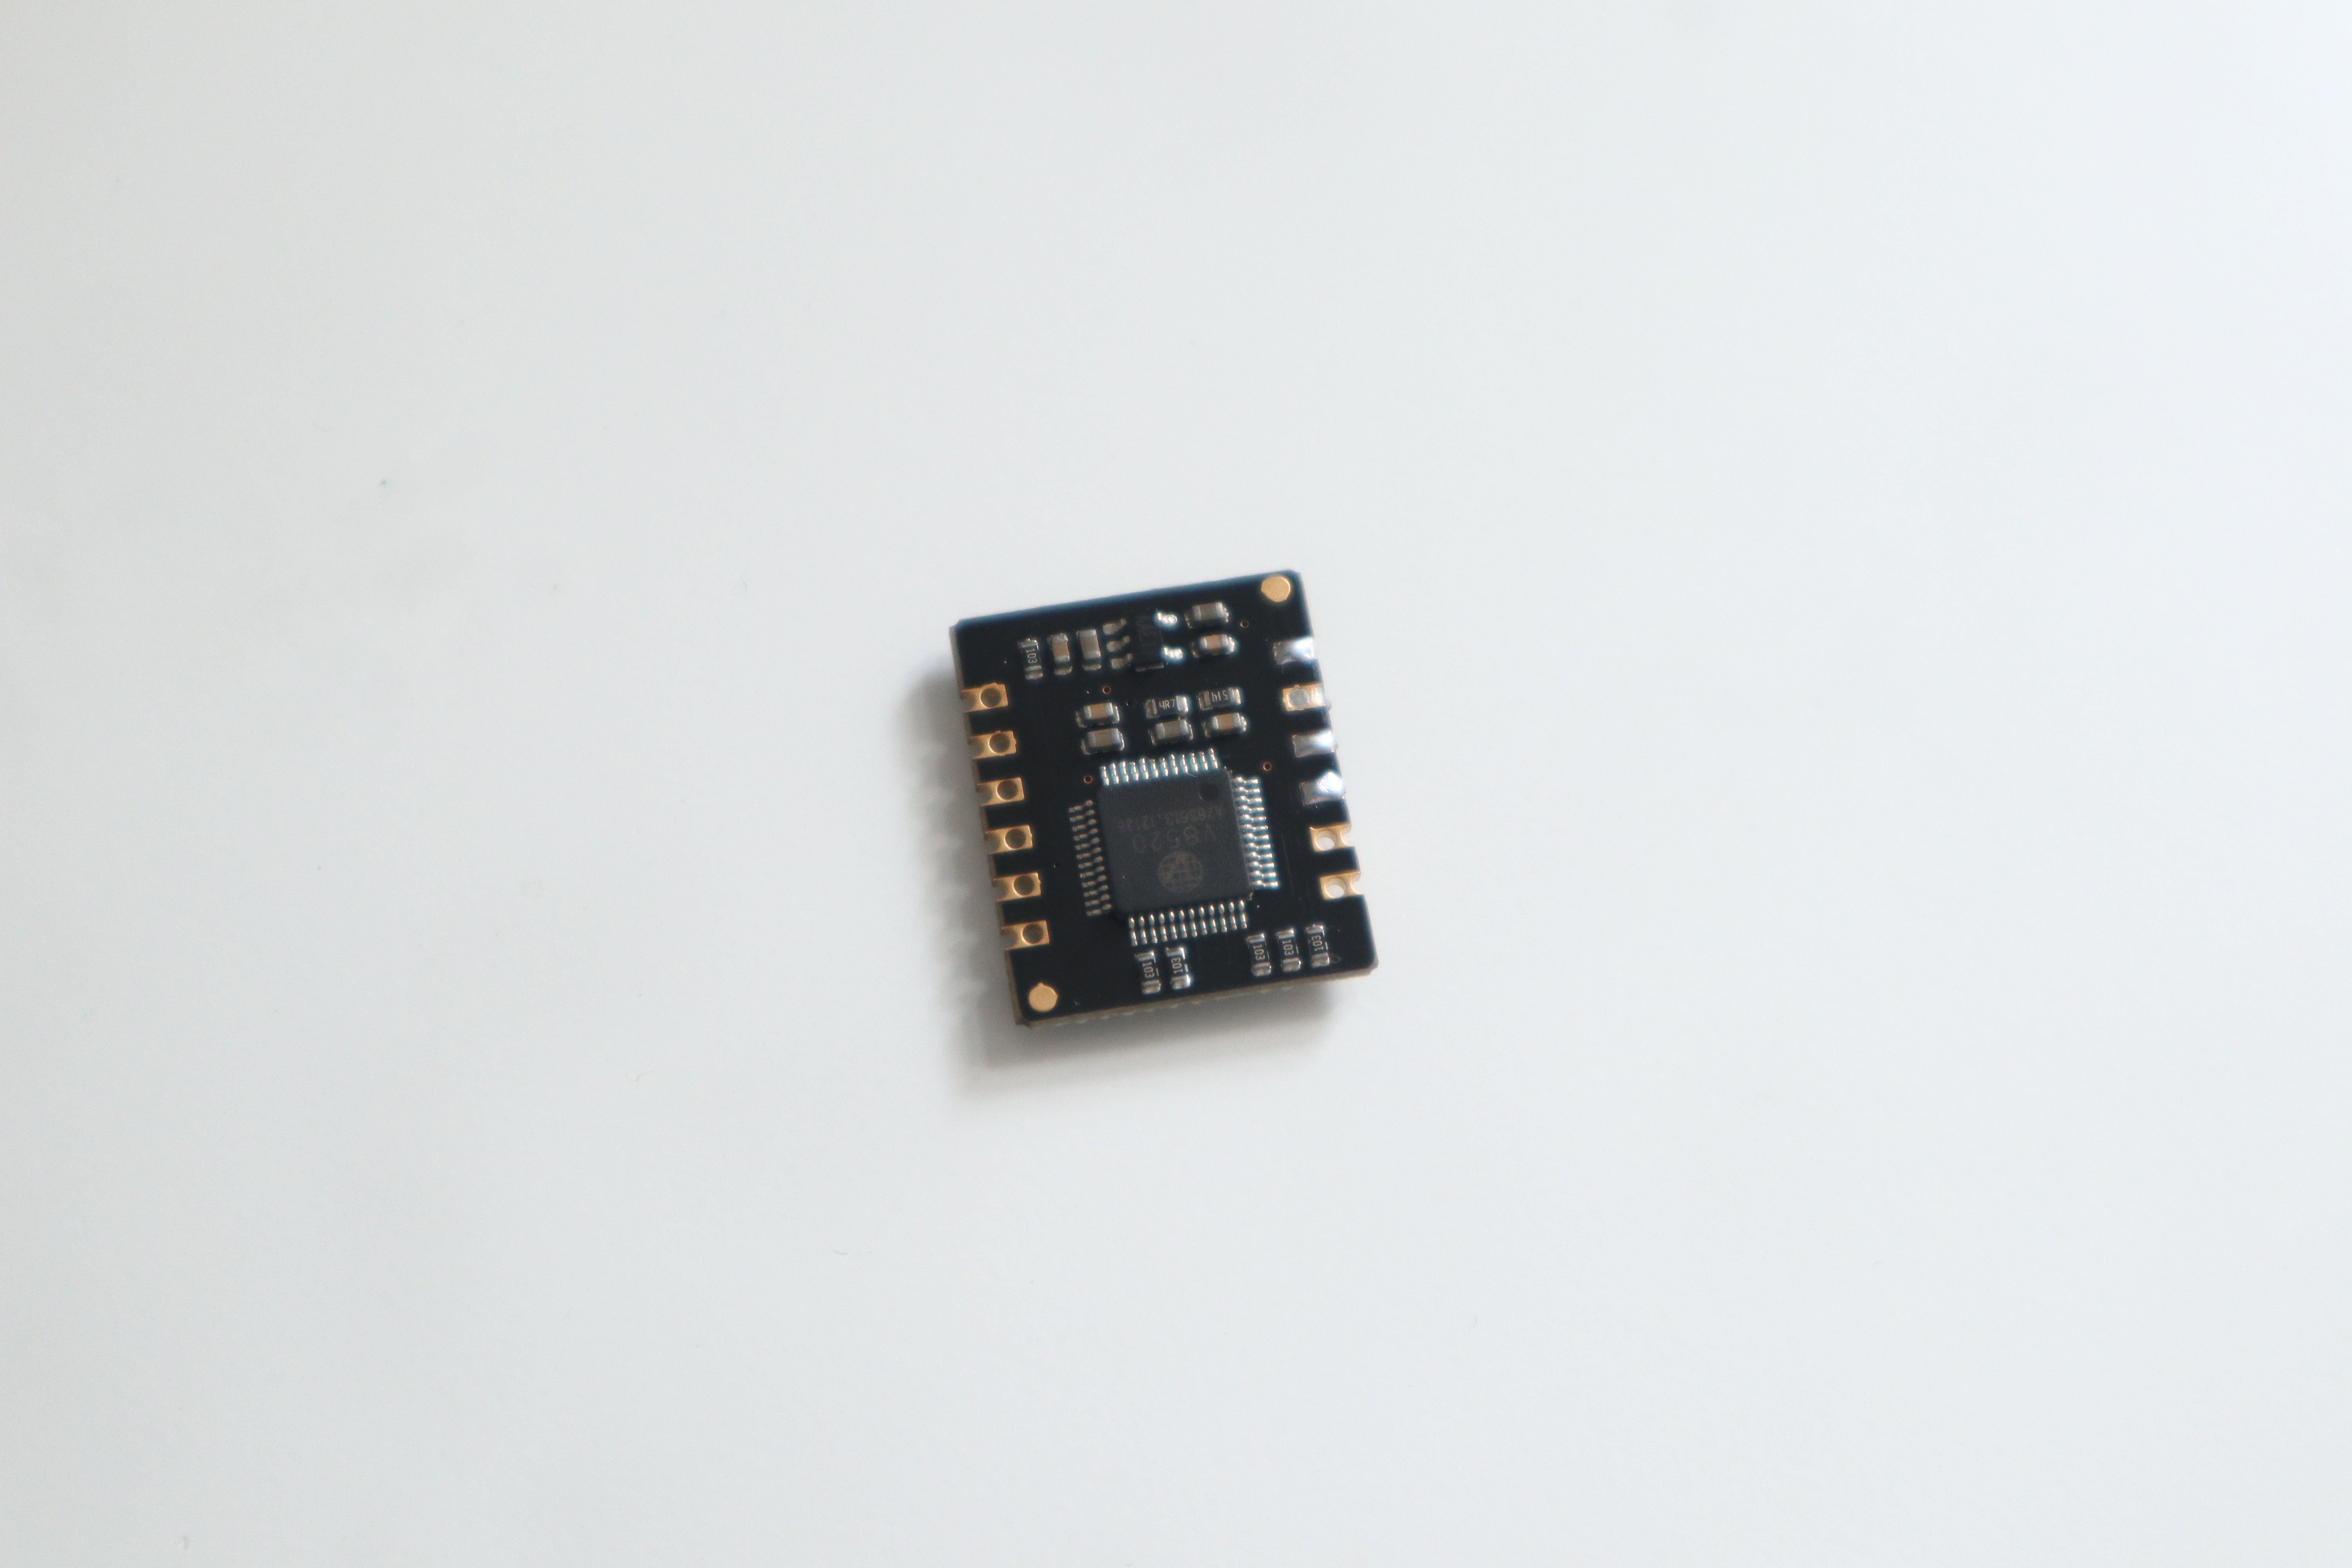
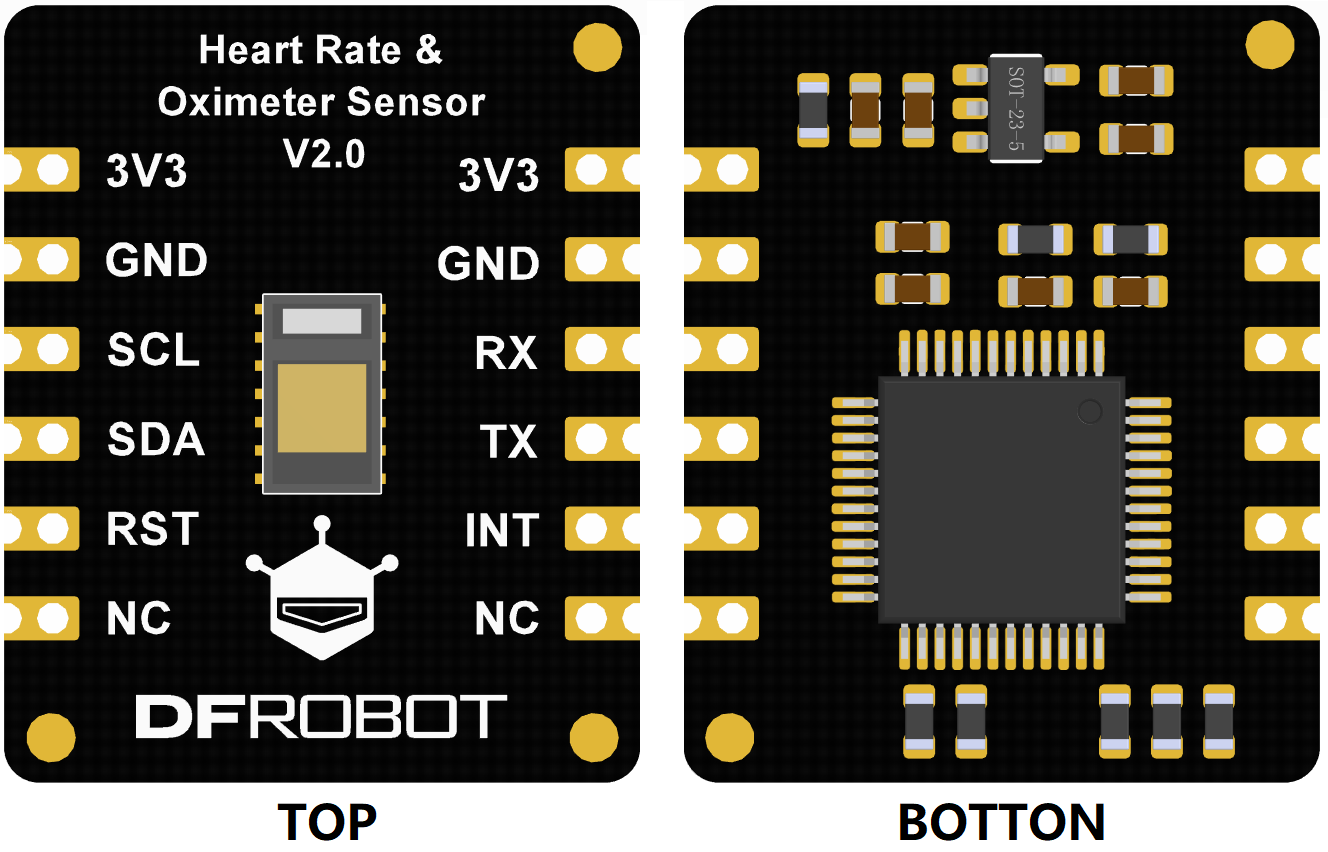
DF Robot MAX30102 PPG Heart Rate and Oximeter Sensor significantly enhance the telemedicine project's diagnostic capabilities. The DFRobot heart rate and oximeter sensor integrates the Maxim MAX30102 chip and an MCU with the heart rate and oximetry algorithm. The MAX30102 uses PPG(PhotoPlethysmoGraphy) to measure data, which will be converted into heart rate and oximetry values when processed by the MCU, then output through I2C or UART, making the sensor easy to use and greatly reducing resource occupation of the main controller.
These are the features
- Power Supply: 3.3V
- Working Current: <50mA
- Communication: I2C/UART
- I2C Address: 0x57
- Baud rate: 9600bps
- Operating Temperature Range: -40℃~85℃
- Dimension: 18×22mm/0.71×0.8
Here I will choose the I2C communication protocol. It's a suitable choice for real-time patient monitoring, as it balances speed and reliability, making it an excellent fit for this project.
MAX30102 has an on-chip temperature sensor that is used to compensate for the changes in the environment and to calibrate the measurements. This is a reasonably precise temperature sensor that measures the ‘die temperature’ in the range of -40˚C to +85˚C with an accuracy of ±1˚C. This is used for measuring the patient's temperature so I don't won't need to add extra sensors for temperature measurement.
4. Analog Heart Rate Monitor Sensor (ECG)
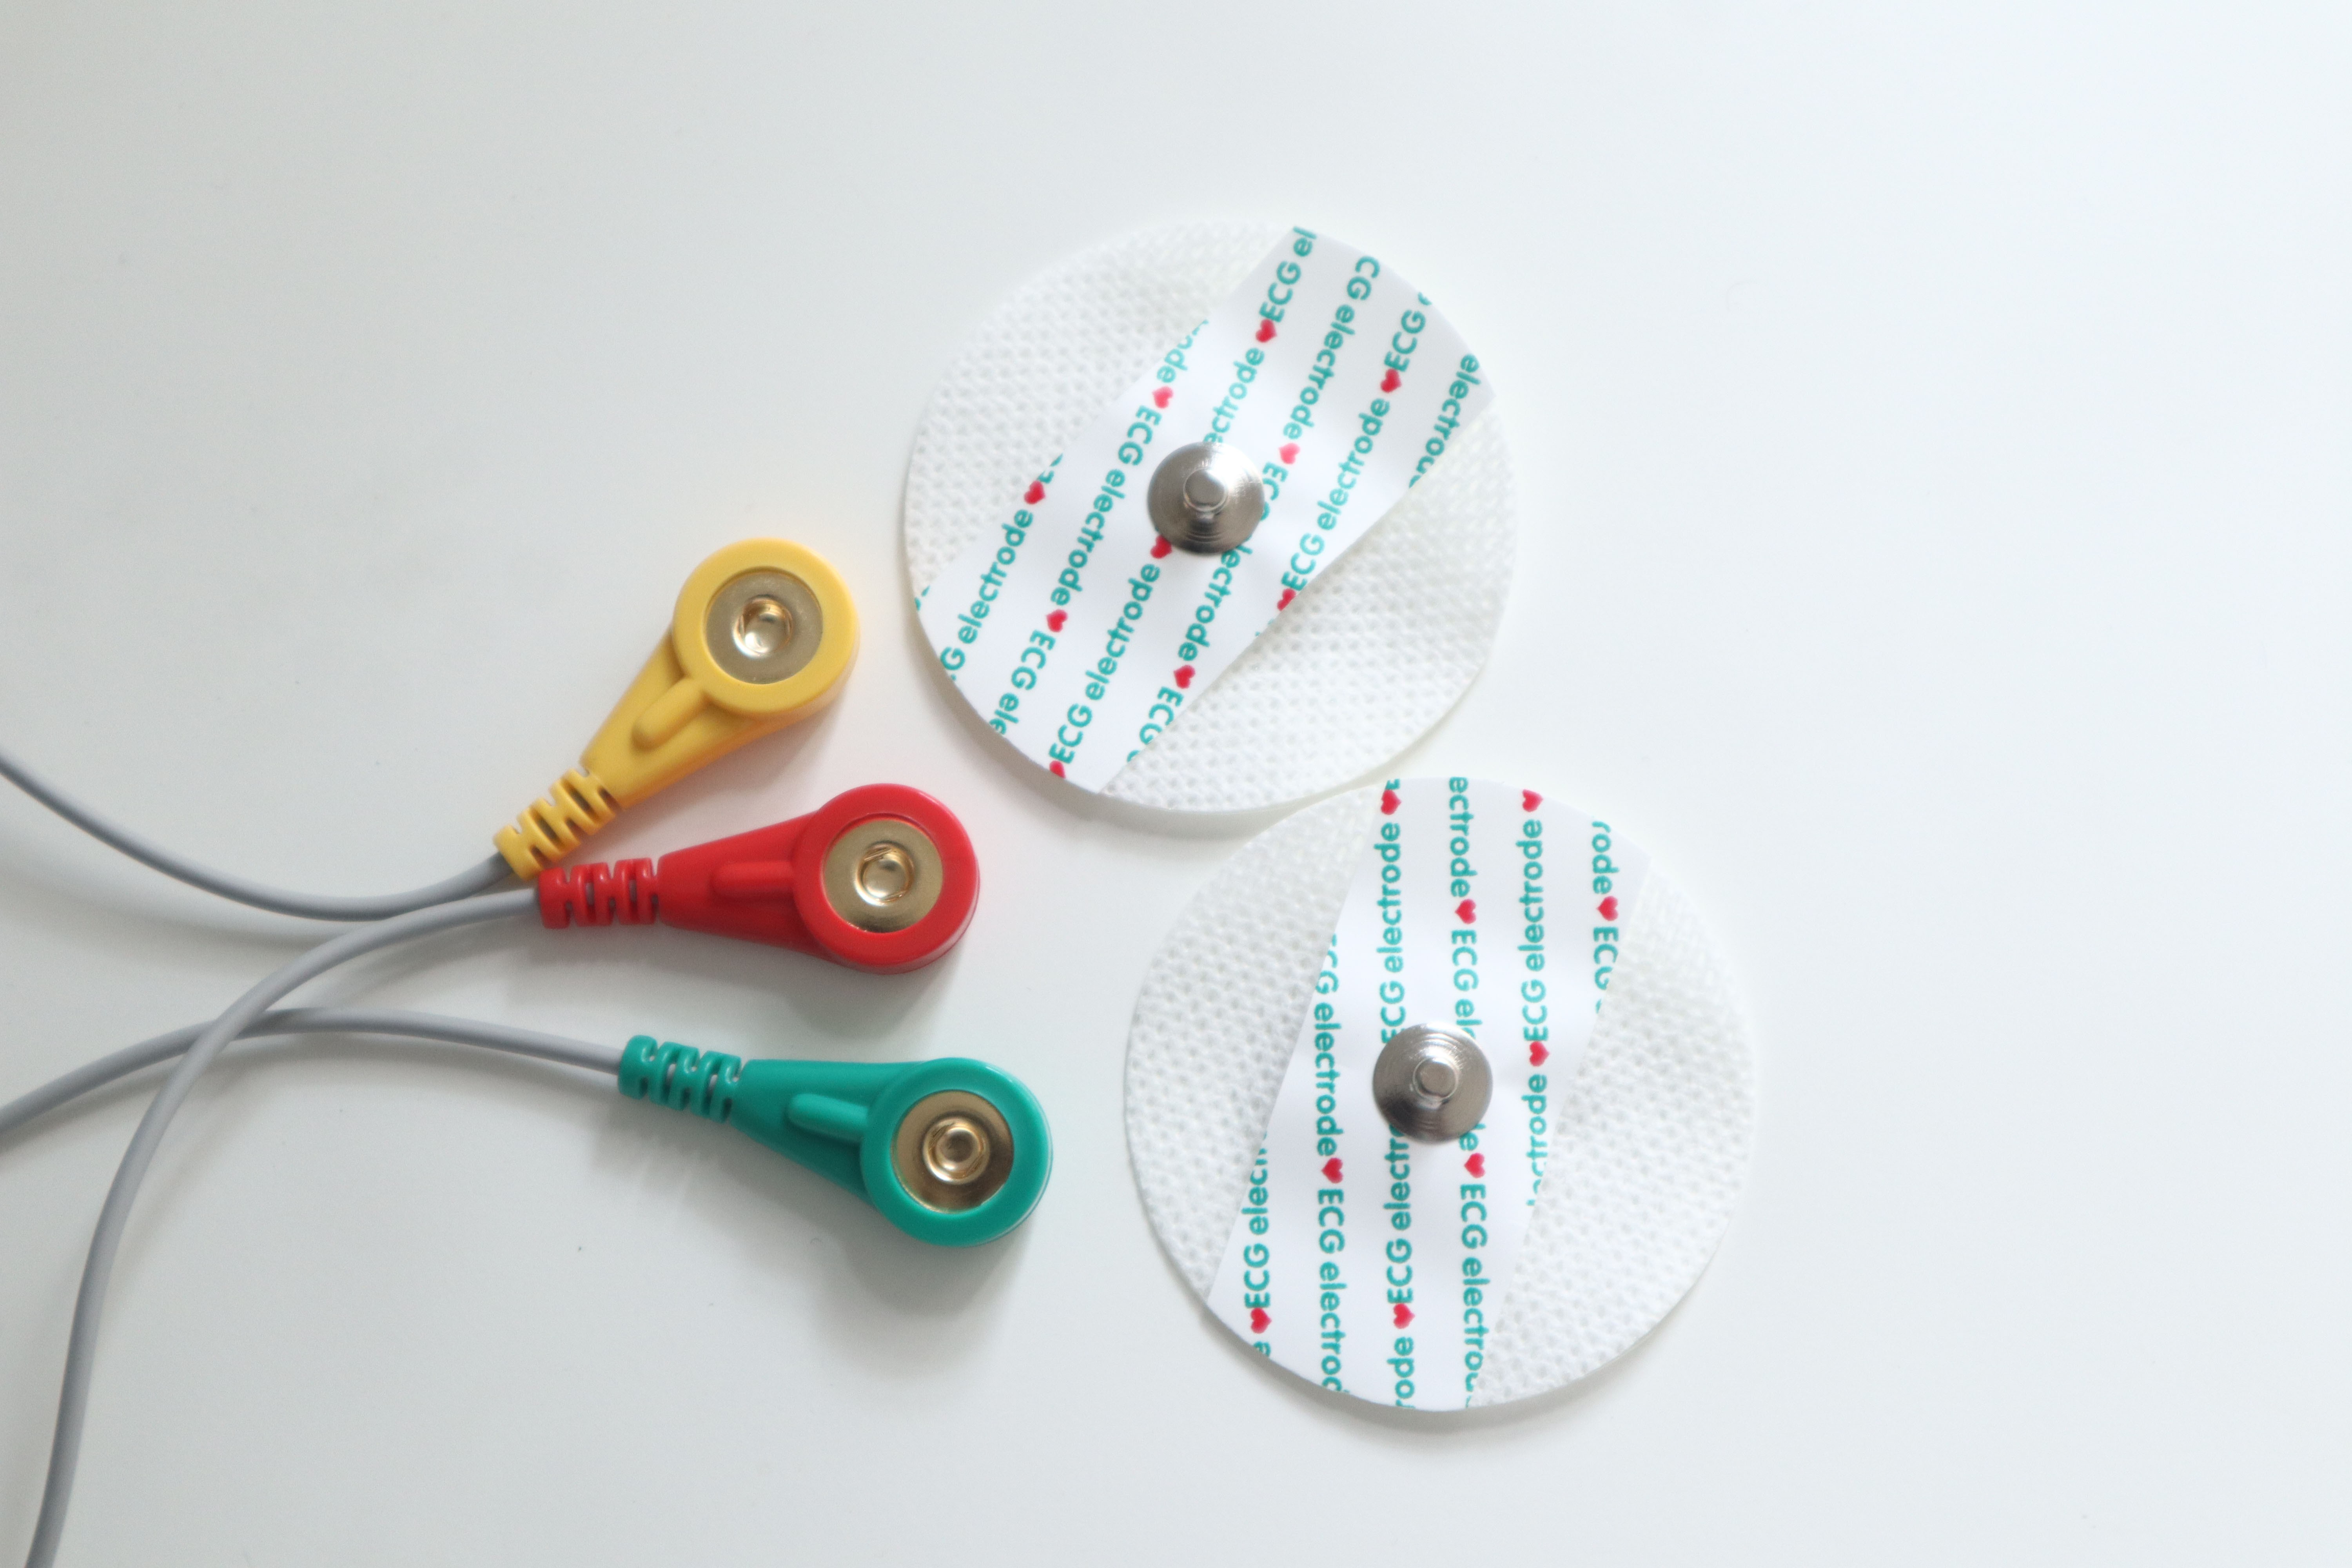
The DFRobot Heart Rate Monitor Sensor is used to measure the electrical activity of the heart. This electrical activity can be charted as an ECG and output as an analog reading.
The main advantage of the ECG sensors is that they capture the entire ECG waveform, including P, QRS, and T waves, which are essential for diagnosing various cardiac conditions. This level of detail is not typically available from PPG sensors like the MAX30102, which focuses on extracting heart rate and oxygen saturation from blood perfusion changes.
An ECG signal can be extremely noisy so they included an AD8232 chip which will generate a clear signal from the PR and QT Intervals.
Here are some major reasons why the AD8232 chip is used in heart rate sensor applications.
- ECG Signal Conditioning: The AD8232 is designed for electrocardiogram (ECG) signal conditioning. It amplifies and filters the weak electrical signals produced by the heart's activity, making them suitable for further process.
- Low Noise Amplification: The AD8232 provides high-quality signal amplification with low noise. This is crucial for accurately capturing the subtle electrical signals generated by the heart, ensuring that the resulting data is reliable and accurate.
- Common Mode Rejection: The chip is equipped with a high common mode rejection ratio (CMRR), which helps eliminate common noise sources, such as interference from surrounding electronics or muscle artefacts. This enhances the purity of the ECG signal.
- Integrated Electrode Driver: The AD8232 includes an integrated electrode driver that helps maintain a stable and consistent interface between the skin and the sensor's electrodes. This ensures reliable and consistent signal capture over extended periods.
- Lead-Off Detection: The chip features lead-off detection capabilities, which can alert users when electrode connections are compromised or if the sensor becomes disconnected from the body. This is important for ensuring data integrity and user safety.
- Compact Integration: The AD8232 is designed to be compact and suitable for wearable devices, making it an ideal choice for heart rate monitor sensors that need to be comfortable for the user and integrate easily into various applications.
- Compatible with Microcontrollers: The chip's analog output can be easily interfaced with microcontrollers for further processing, data analysis, and transmission to external devices or displays.
- Medical Certification: The AD8232 is often used in medical-grade devices and has received regulatory approvals, making it a reliable choice for applications that require adherence to medical standards.
Here I will be going to put the leads into my right arm, left arm, and right leg.
5. XIAO nRF52840 Sense For Movement Detection
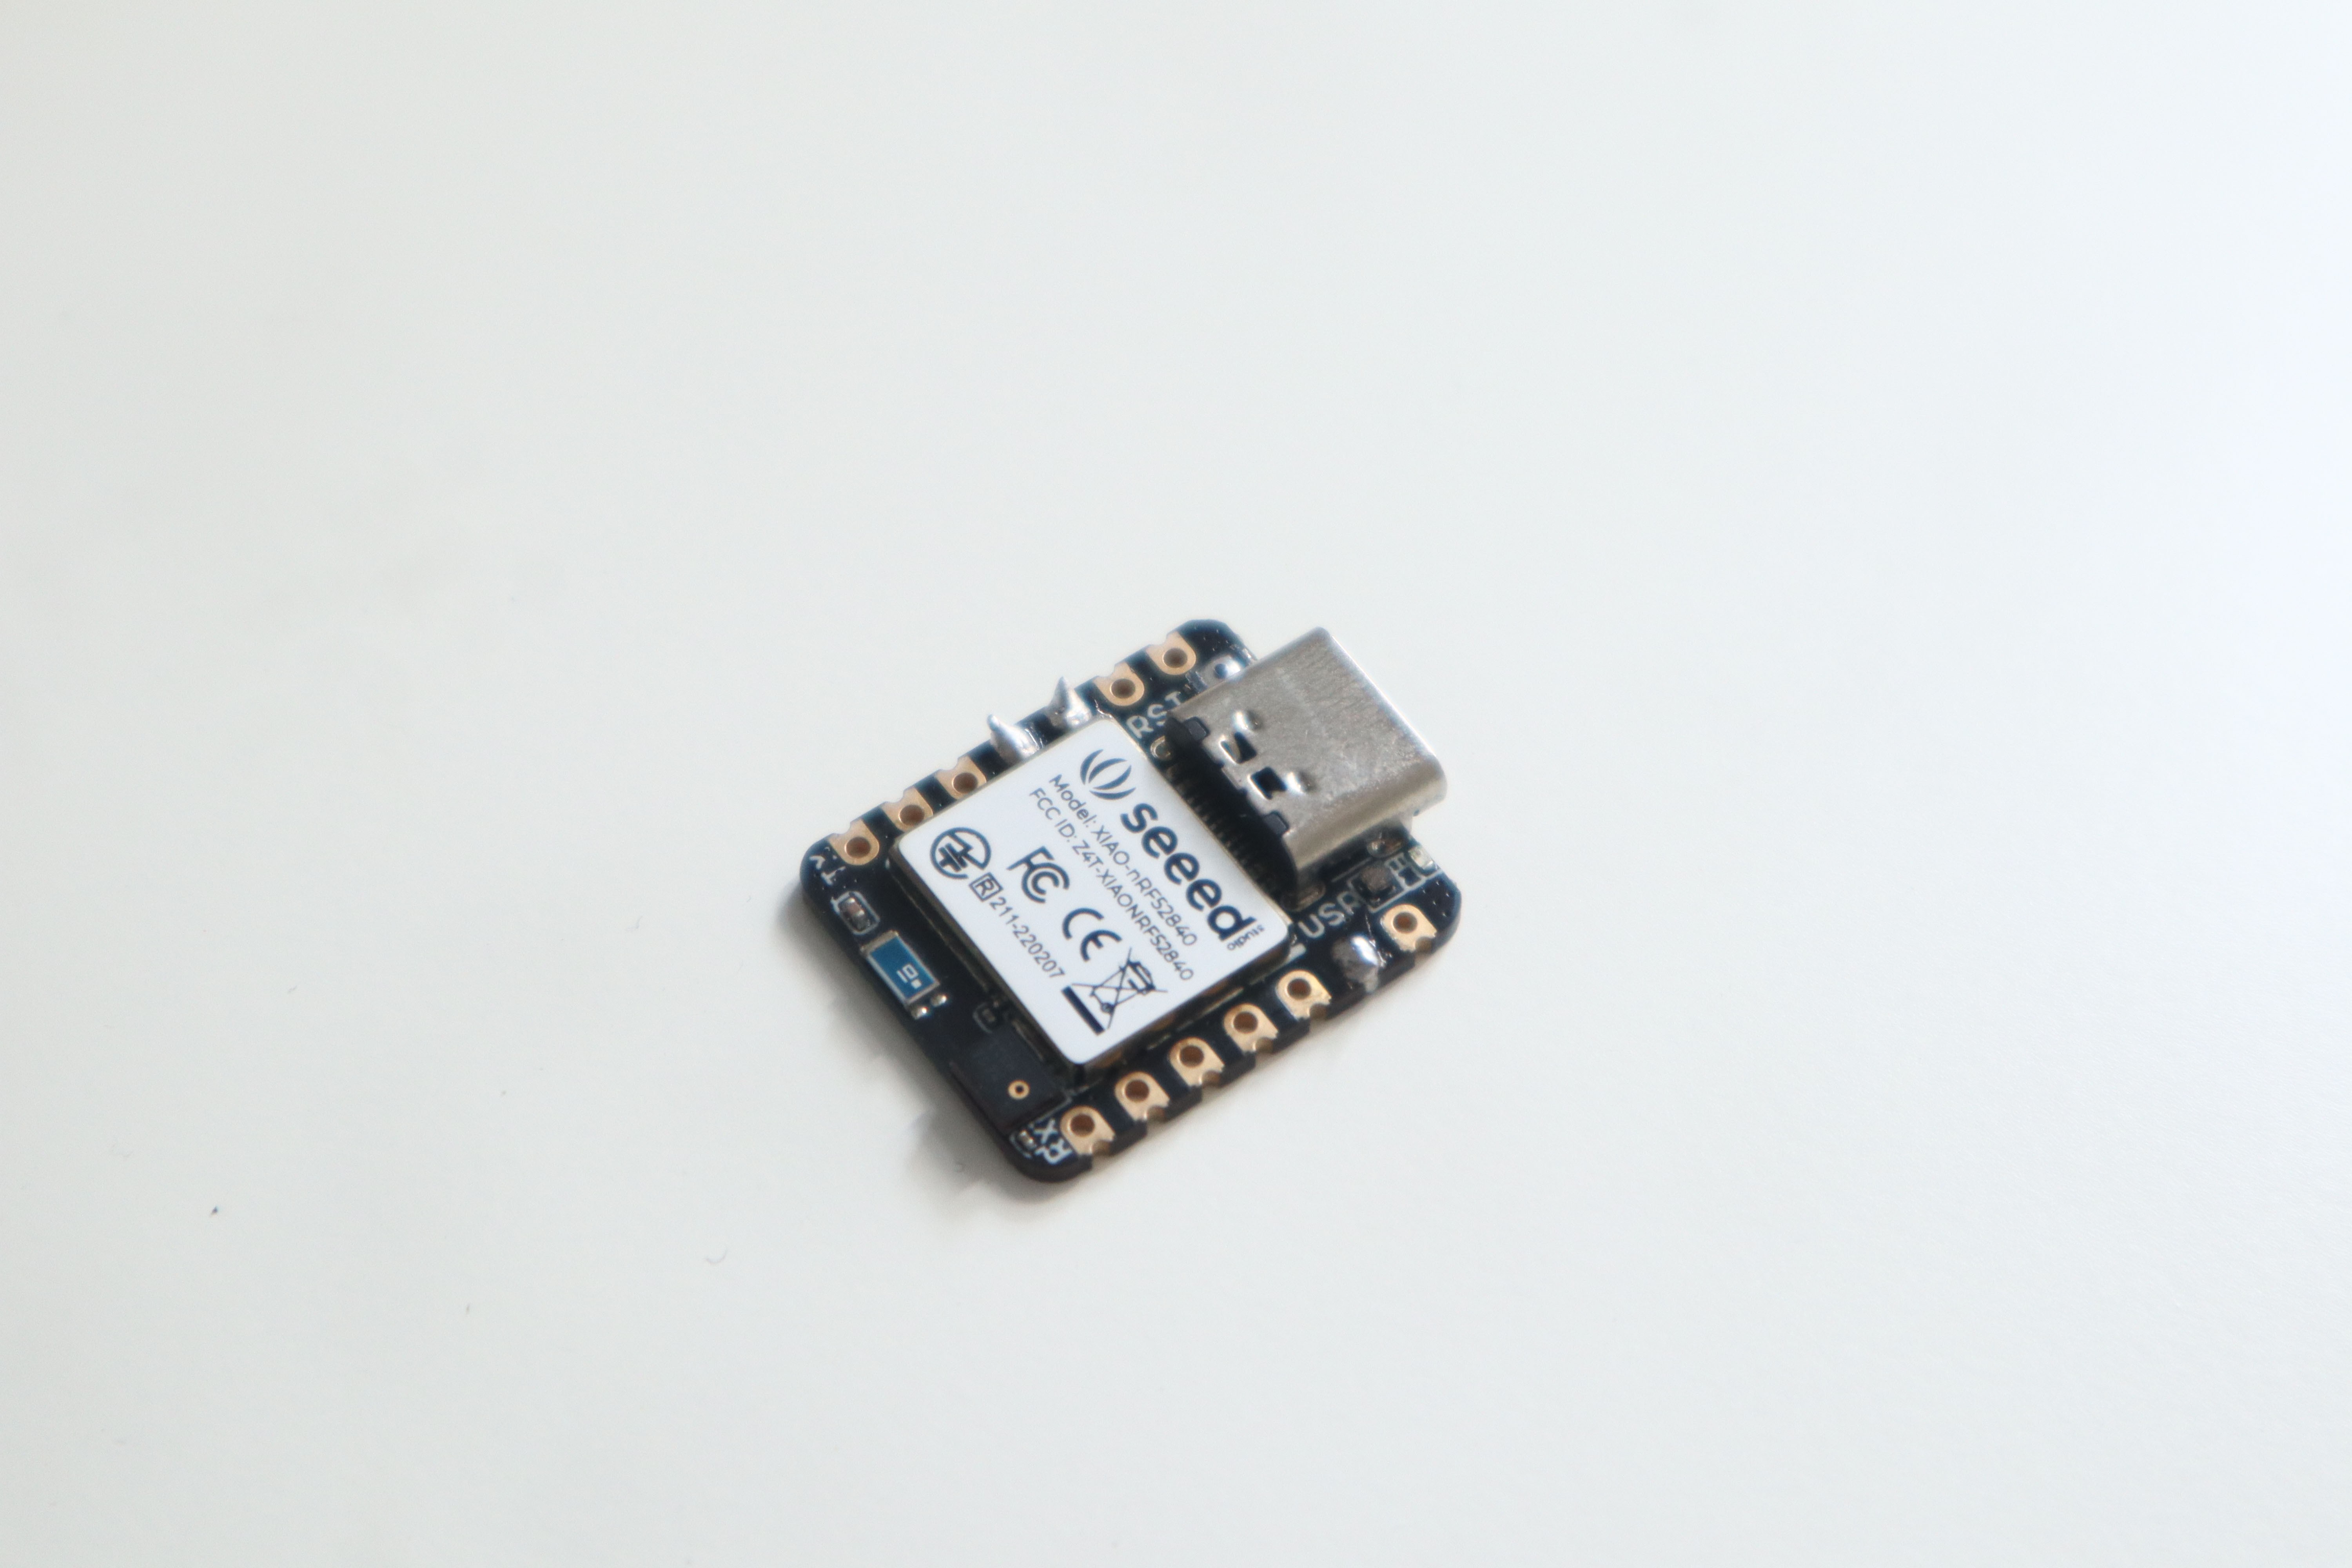
Seeed Studio XIAO nRF52840 Sense carries Bluetooth 5.0 wireless capability and is able to operate with low power consumption. Featuring onboard IMU and PDM, it can be the best tool for embedded Machine Learning projects.
One of the major reasons why I used this board for machine learning is due to its small form factor which easily fits into the finger probe. They serially transfer the data to the STM32 if there are any movements.
We will use the accelerometer(LSM6DS3) on Seeed Studio XIAO nRF52840 Sense combined with Edge Impulse to enable motion recognition. After applying the TinyML model to XIAO nRF52840 Sense we will be able to detect the following
- Idle state
- Hand Raise (For calling Nurse)
- Anomalous motion
Using Edge Impulse you can quickly collect real-world sensor data, train ML models on this data in the cloud, and then deploy the model back to your device. Here I am only talking about the primary process, If you are just a beginner read this.
Data acquisition
Data is an unavoidable part of the machine learning model, for the data acquisition upload this code to the XIAO.
#include "LSM6DS3.h"
#include "Wire.h"

LSM6DS3 myIMU(I2C_MODE, 0x6A);  //I2C device address 0x6A

#define CONVERT_G_TO_MS2 9.80665f
#define FREQUENCY_HZ 50
#define INTERVAL_MS (1000 / (FREQUENCY_HZ + 1))
static unsigned long last_interval_ms = 0;

void setup() {
    Serial.begin(115200);
    while (!Serial);
    if (myIMU.begin() != 0) {
    Serial.println("Device error");
    } else {
    Serial.println("Device OK!");
    }
}
void loop() {
    if (millis() > last_interval_ms + INTERVAL_MS) {
    last_interval_ms = millis();
    Serial.print(myIMU.readFloatAccelX() * CONVERT_G_TO_MS2, 4);
    Serial.print('\t');
    Serial.print(myIMU.readFloatAccelY() * CONVERT_G_TO_MS2, 4);
    Serial.print('\t');
    Serial.println(myIMU.readFloatAccelZ() * CONVERT_G_TO_MS2, 4);
    }
}
After successfully uploading the code we will start the data forwarder by running this command
edge-impulse-data-forwarderThen I connected the XIAO to the Edge Impulse with the CLI after entering my Edge Impulse account credentials.
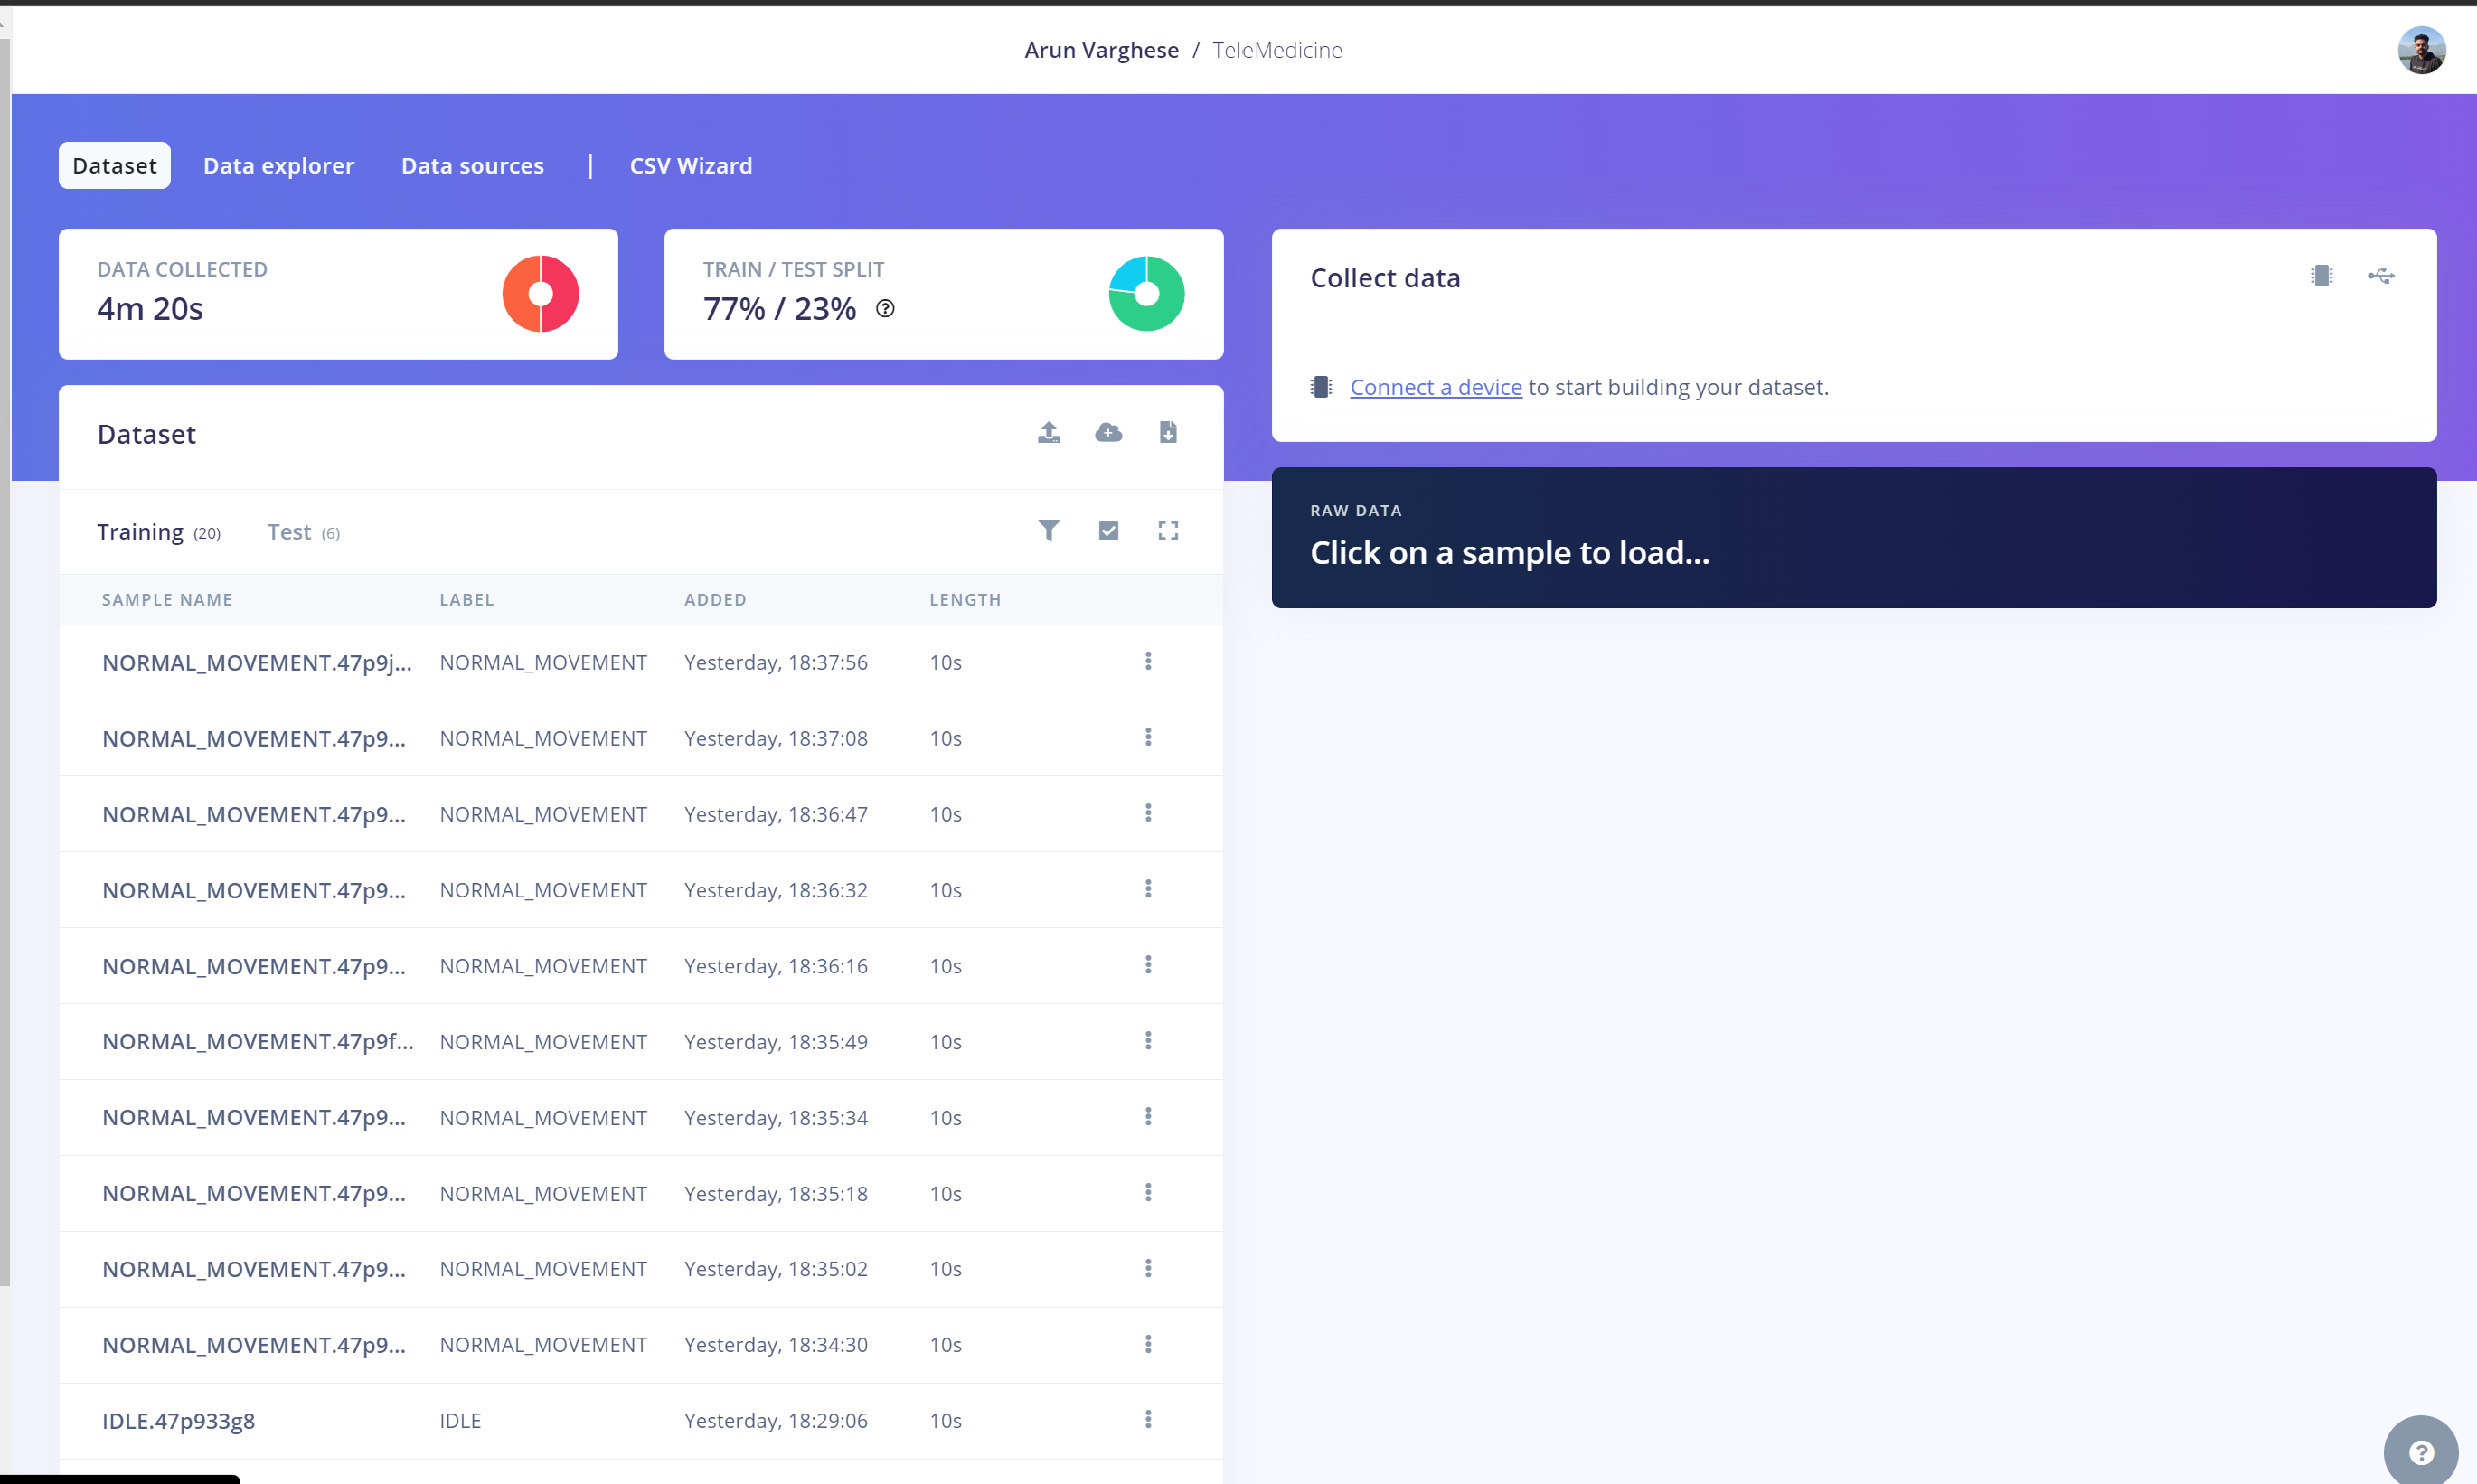
Then I moved to the Data collection tab and started collecting the data. Around 4 minutes of data was collected for Hand Raise and Idle state. Then split it between testing and training and also split the data.
Impulse
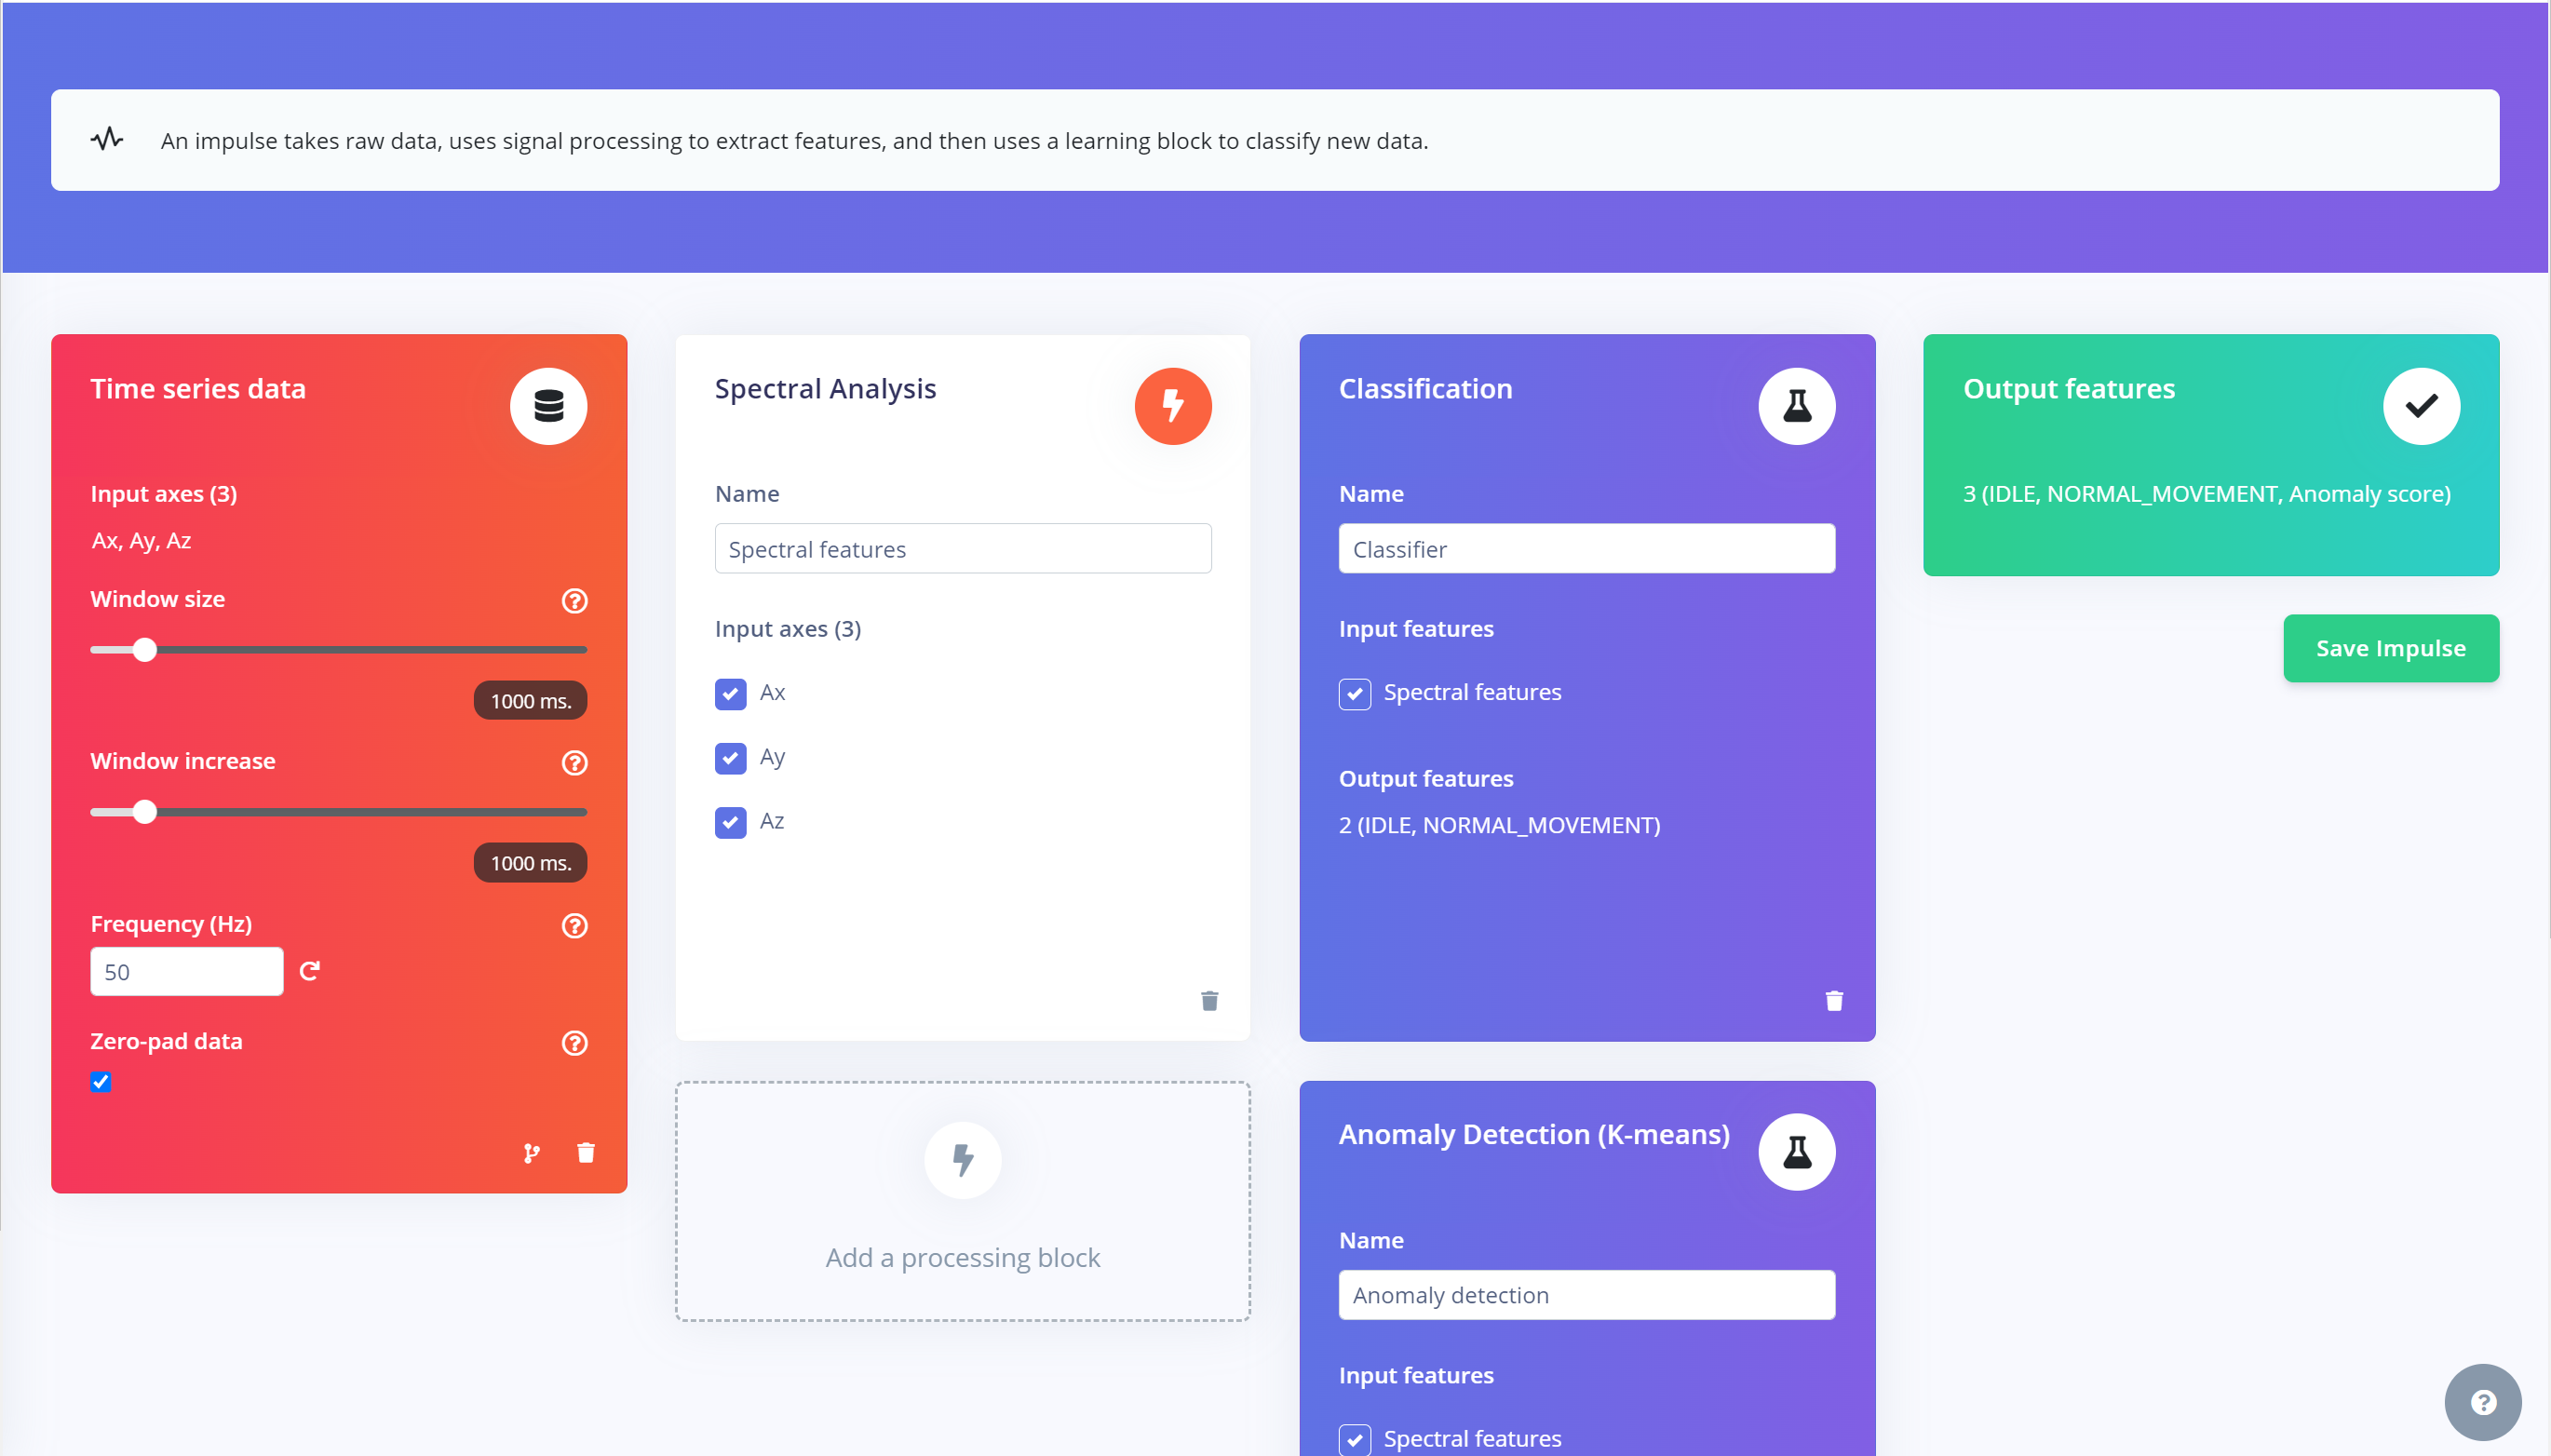
Impulse stands for machine learning pipeline in Edge Impulse which is actually used for feature generation which is a key thing in Machine Learning.
Although neural networks are fantastic, they have one major problem. They're useless when it comes to dealing with data they've never seen before (like a new activity). Because neural networks only have access to training data, they are unable to assess this. Even if you offer it something entirely different beyond what it's seen before, it'll still fall into one of the four categories. So we also added an anomaly detection block to find the anomalies in the motions. They will actually stand out in the output. They are used here to find the anomalous motion of patients.
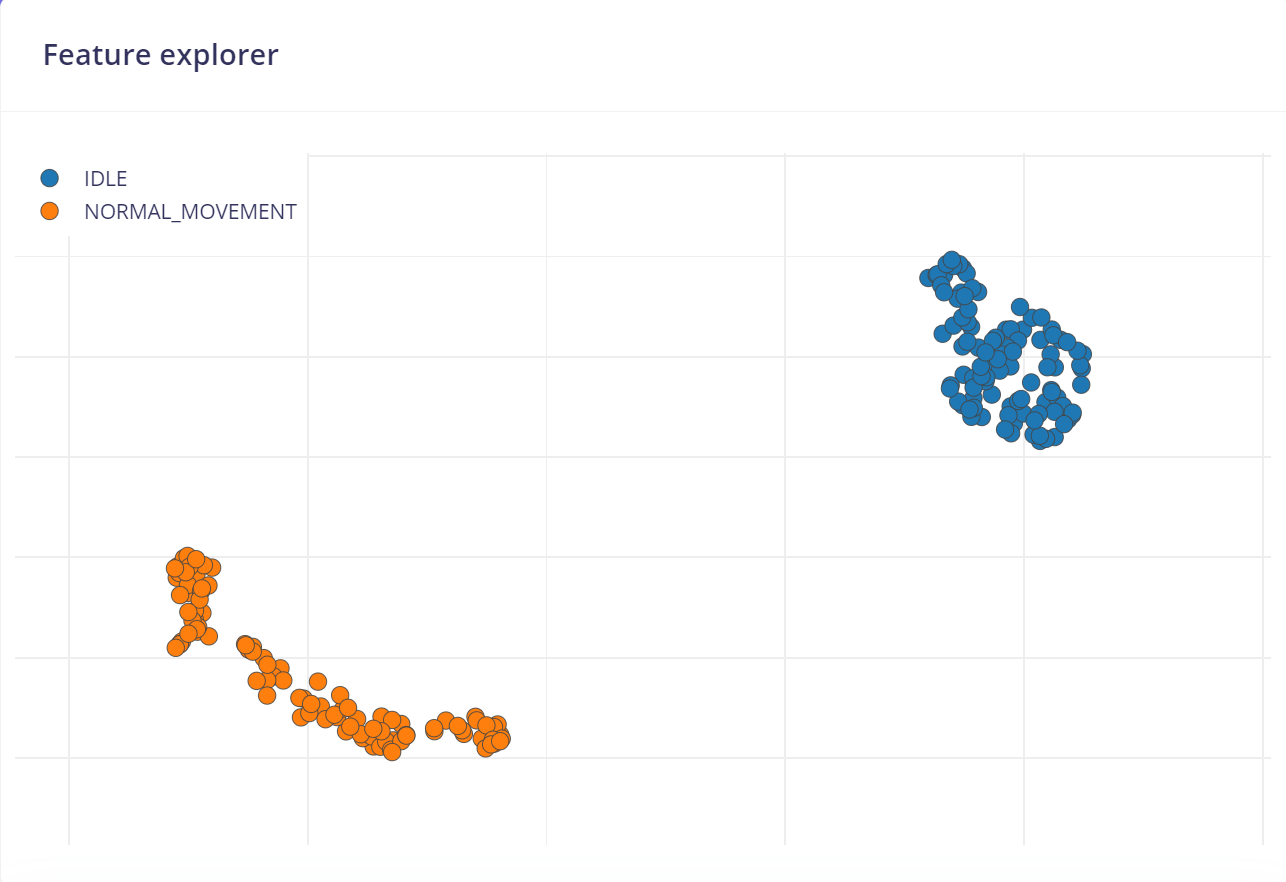
This feature explorer window shows the features extracted from the data we have given.
Neural Network Settings
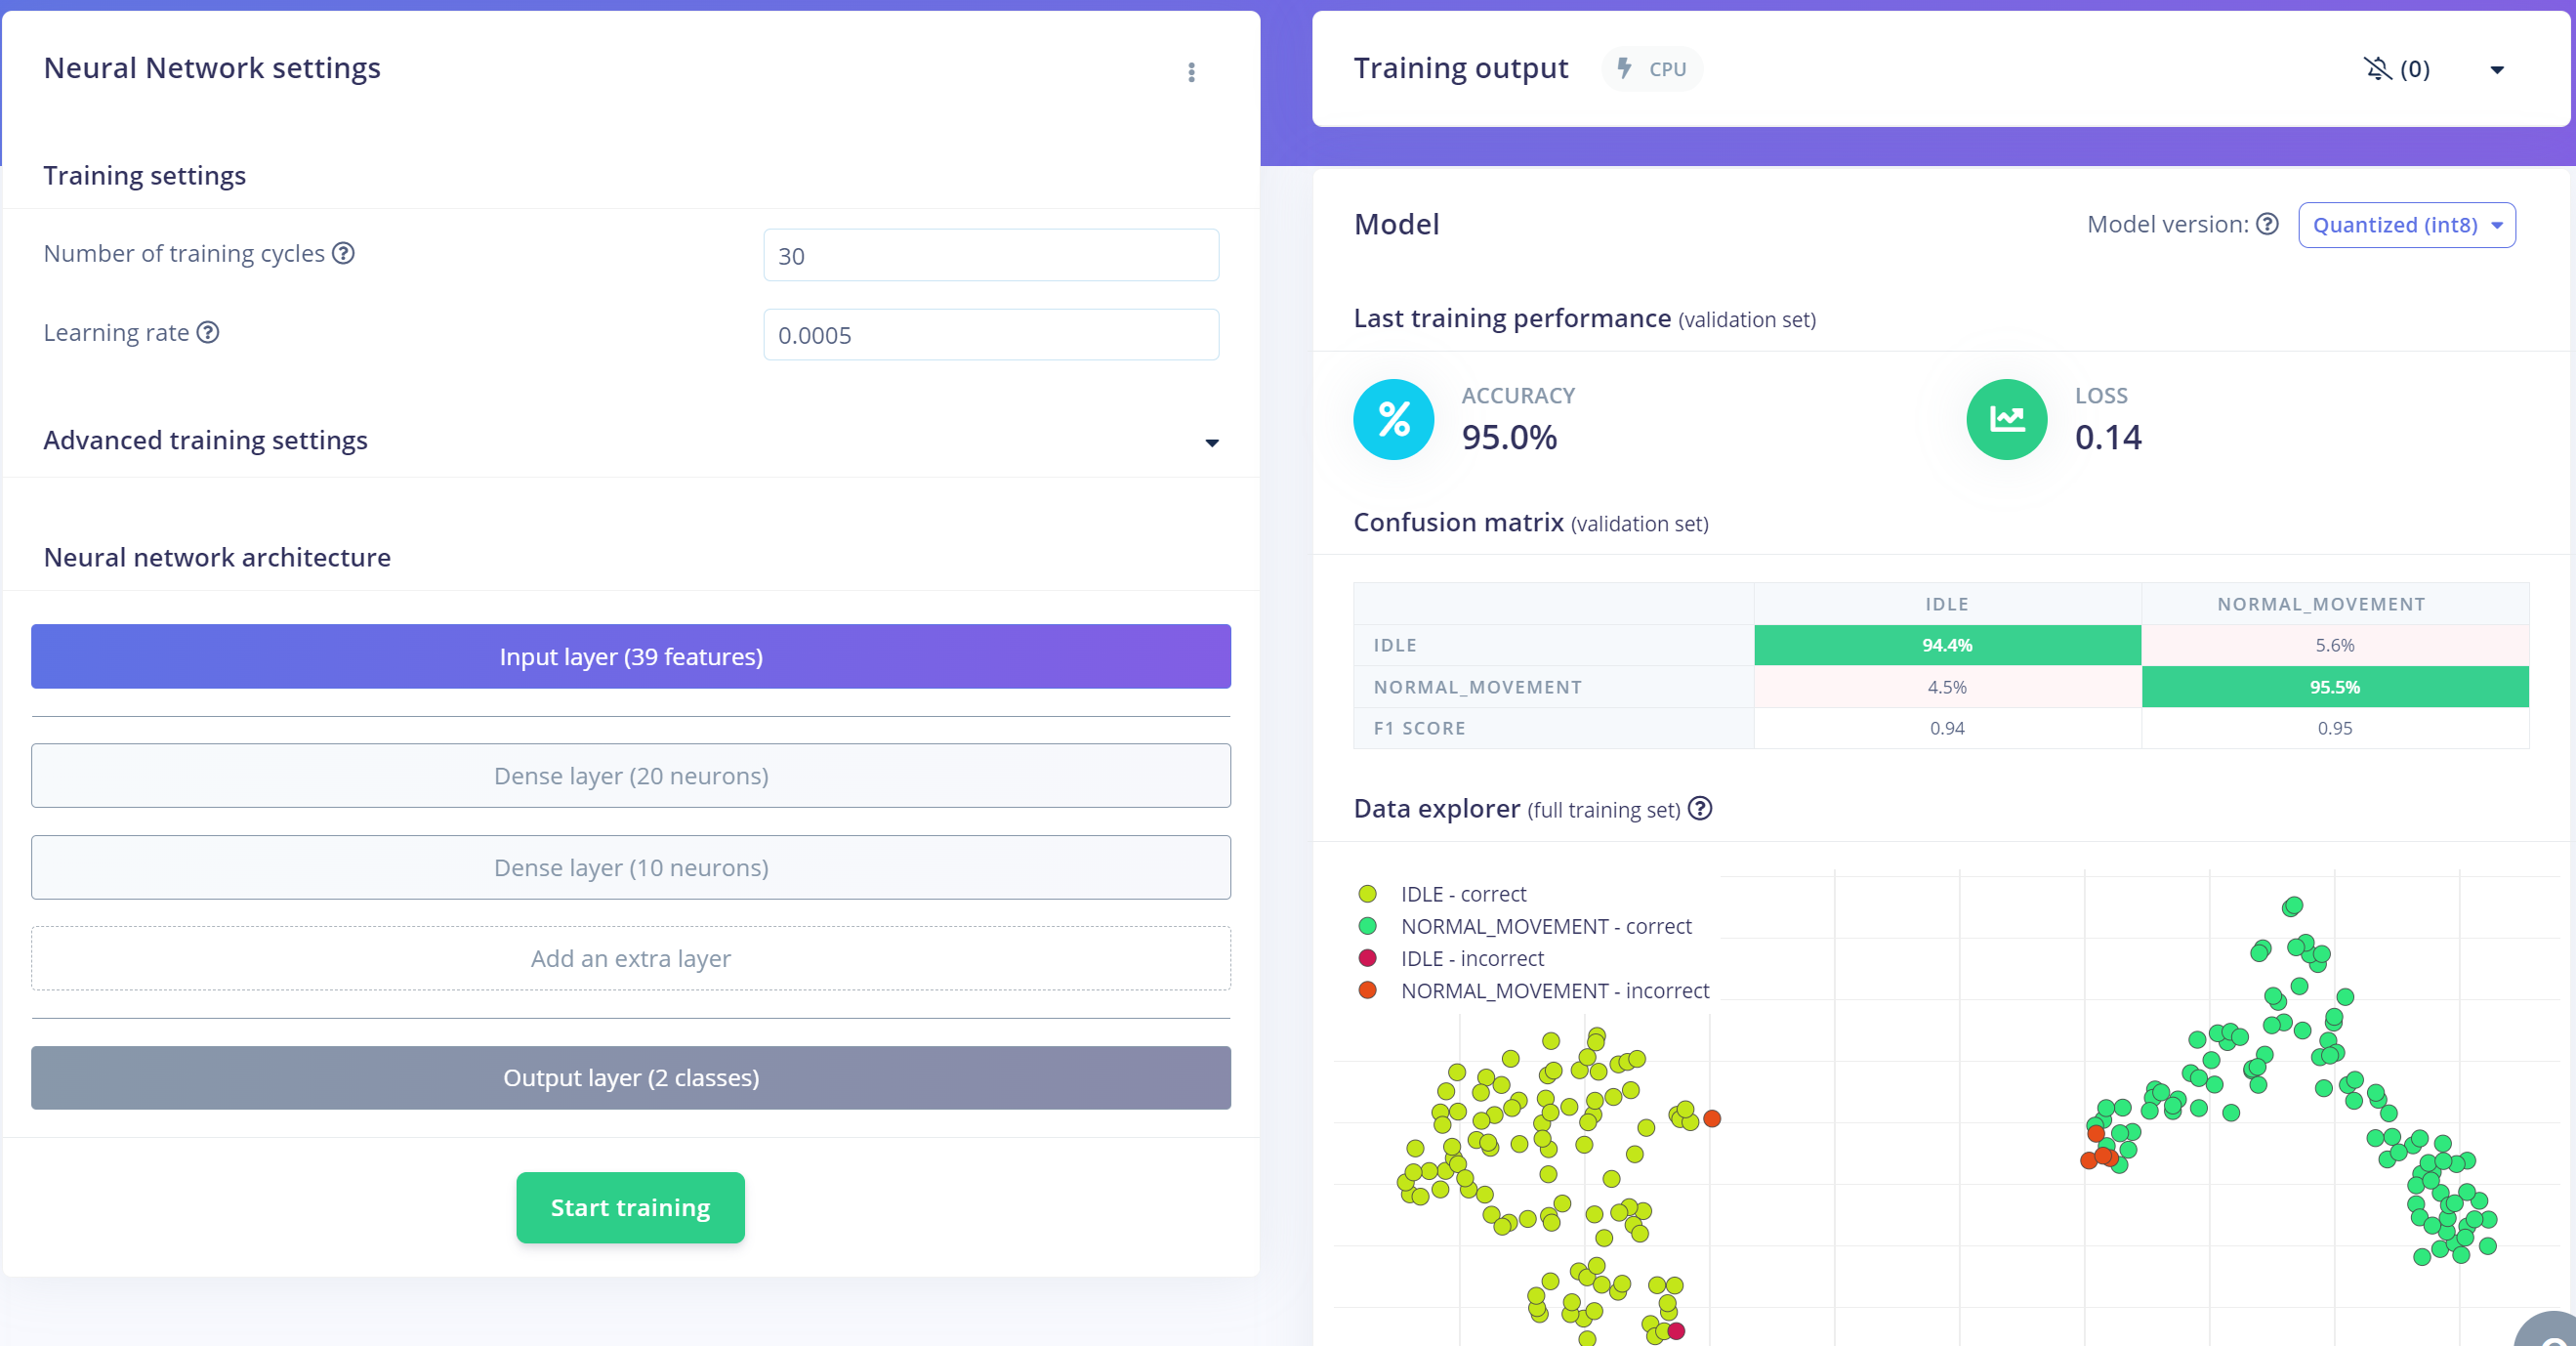
These are my neural network settings for this project. By using these settings we made 95% accuracy for the model which is very awesome.
Deploying
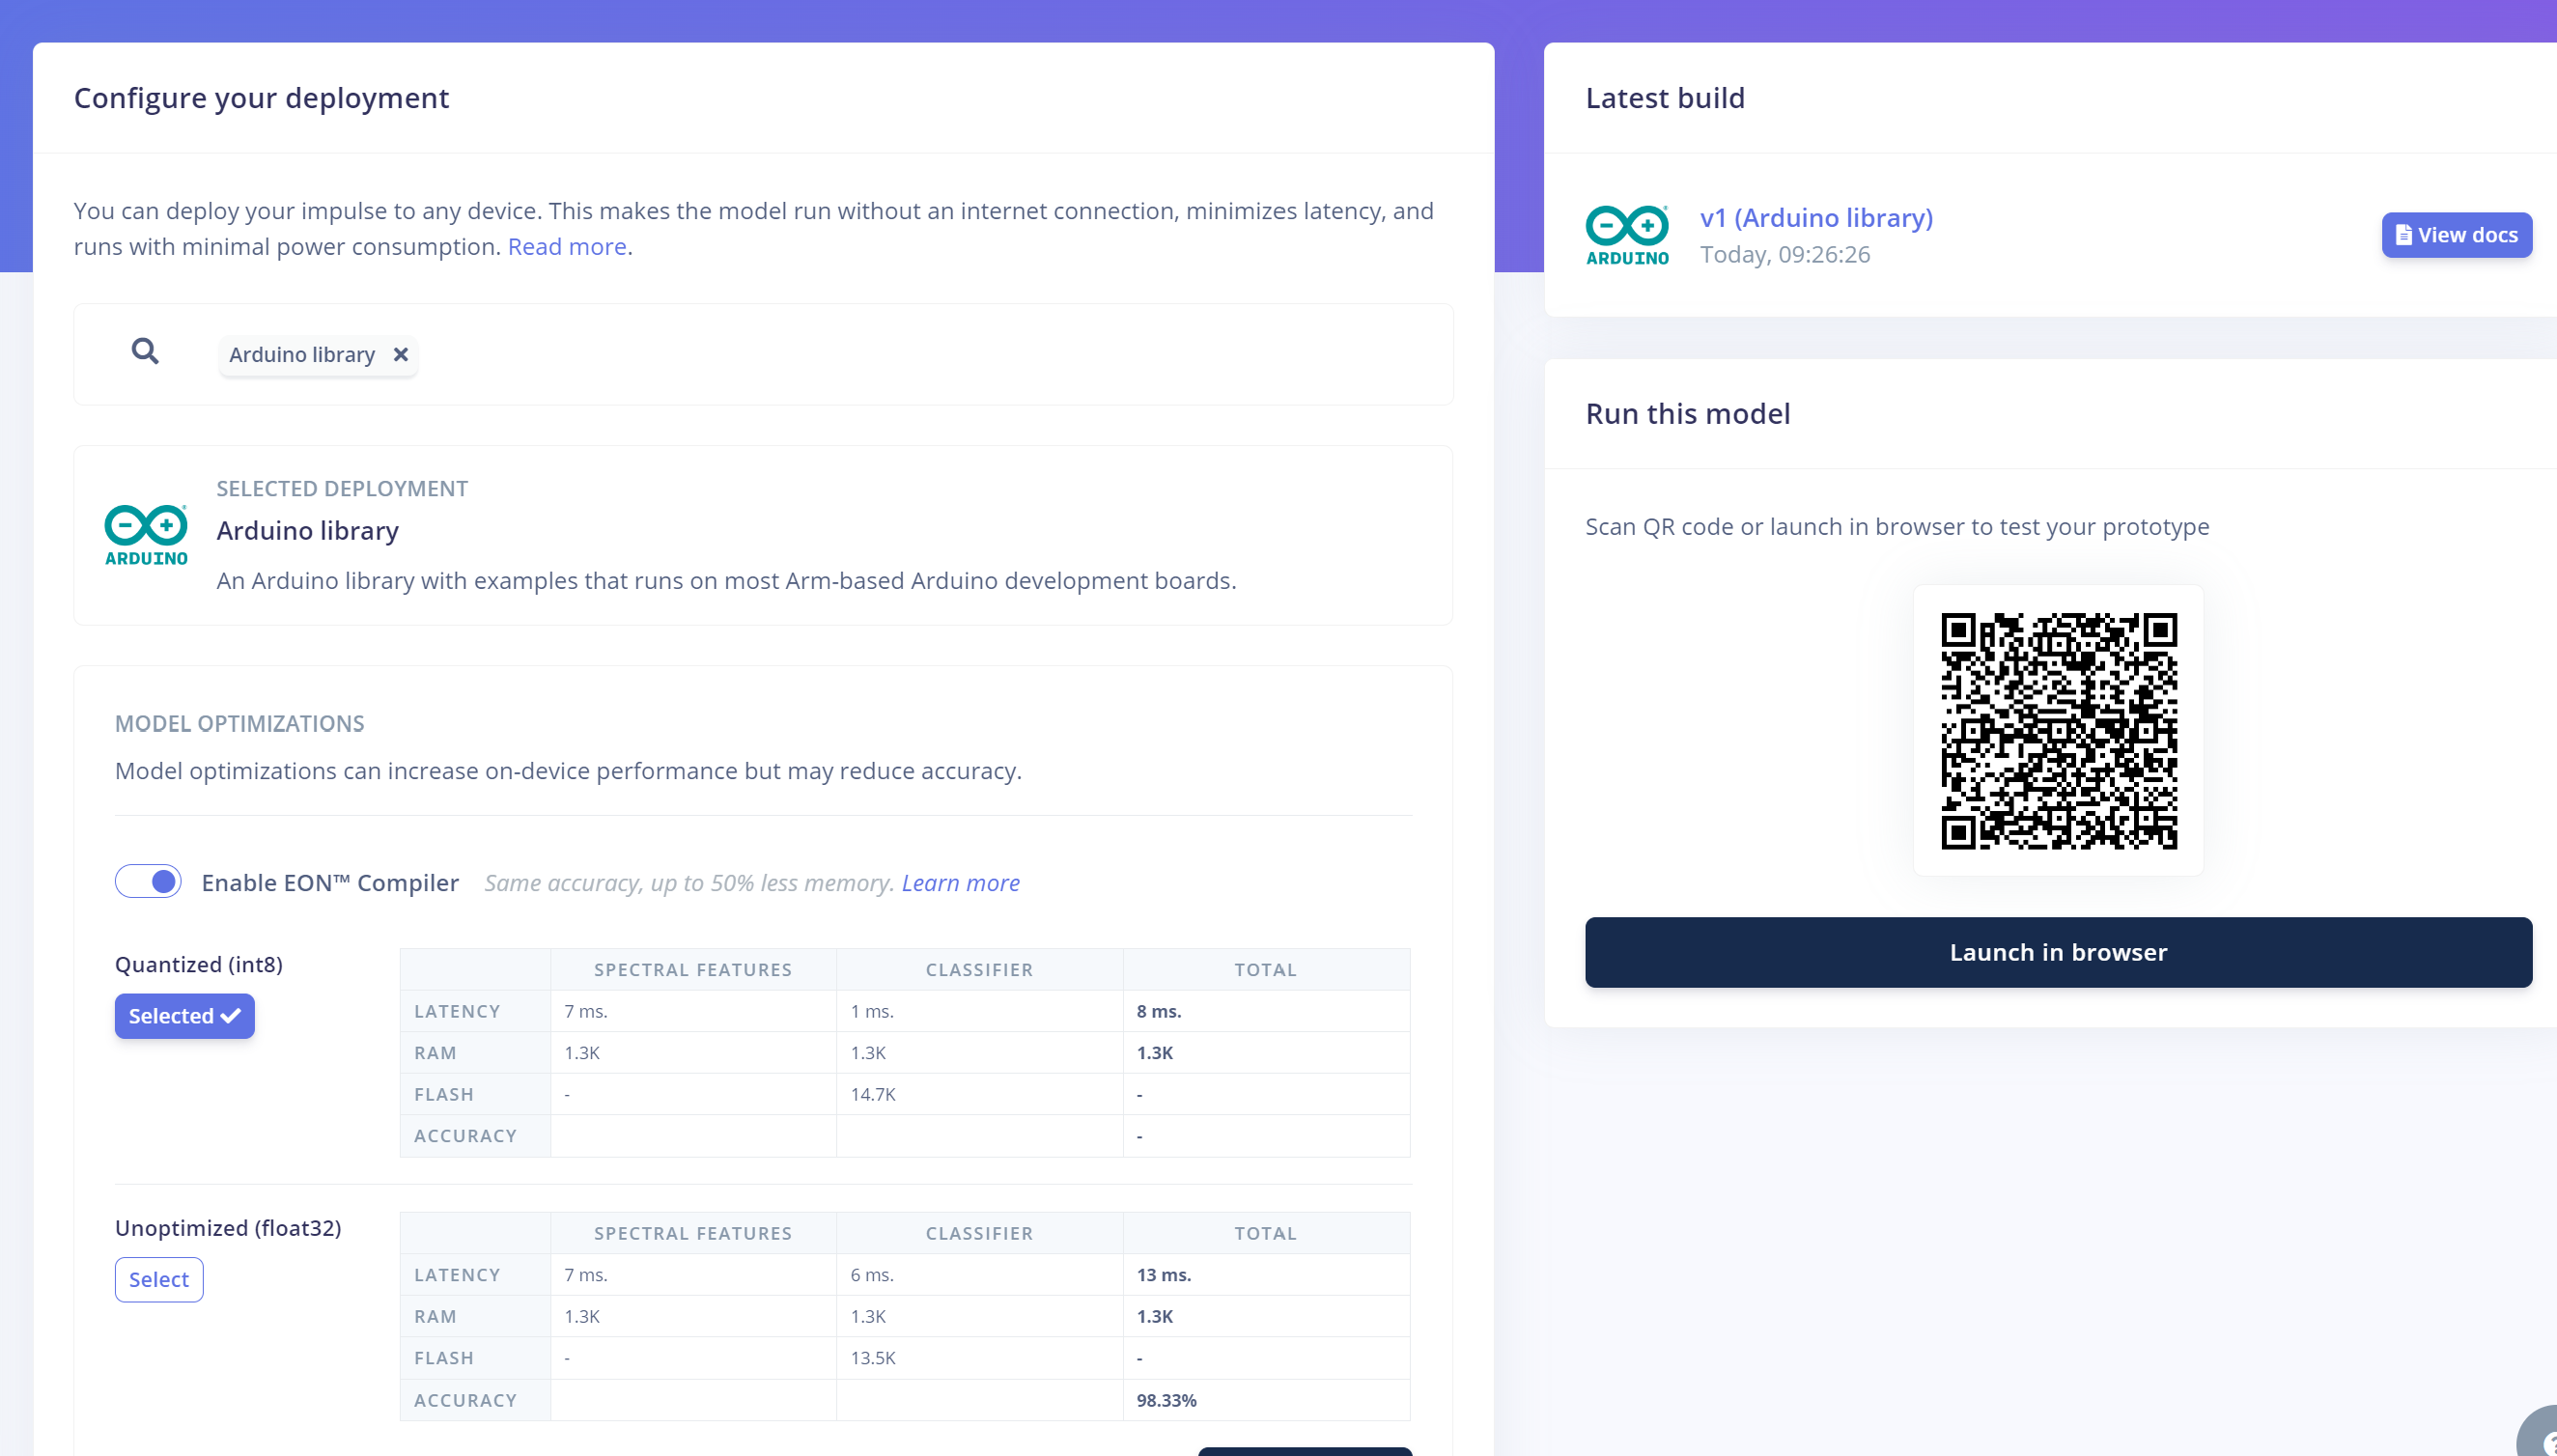
Here I used Arduino Library for deploying into the XIAO. You can find the machine learning code in the GitHub repo.
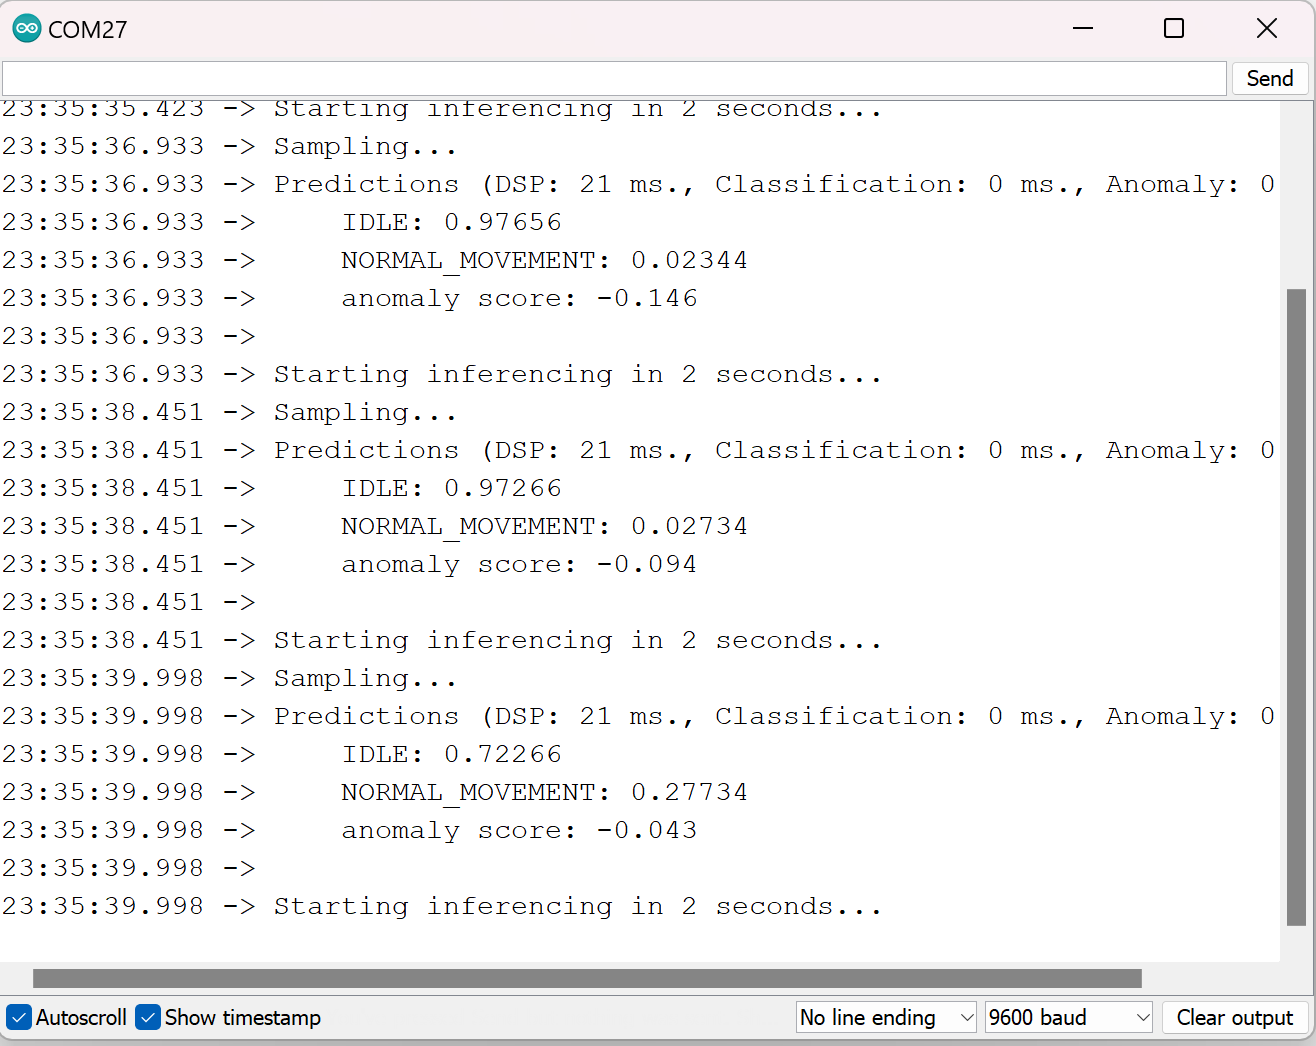
This is the serial monitor output of Arduino when the XIAO is in the IDLE state.
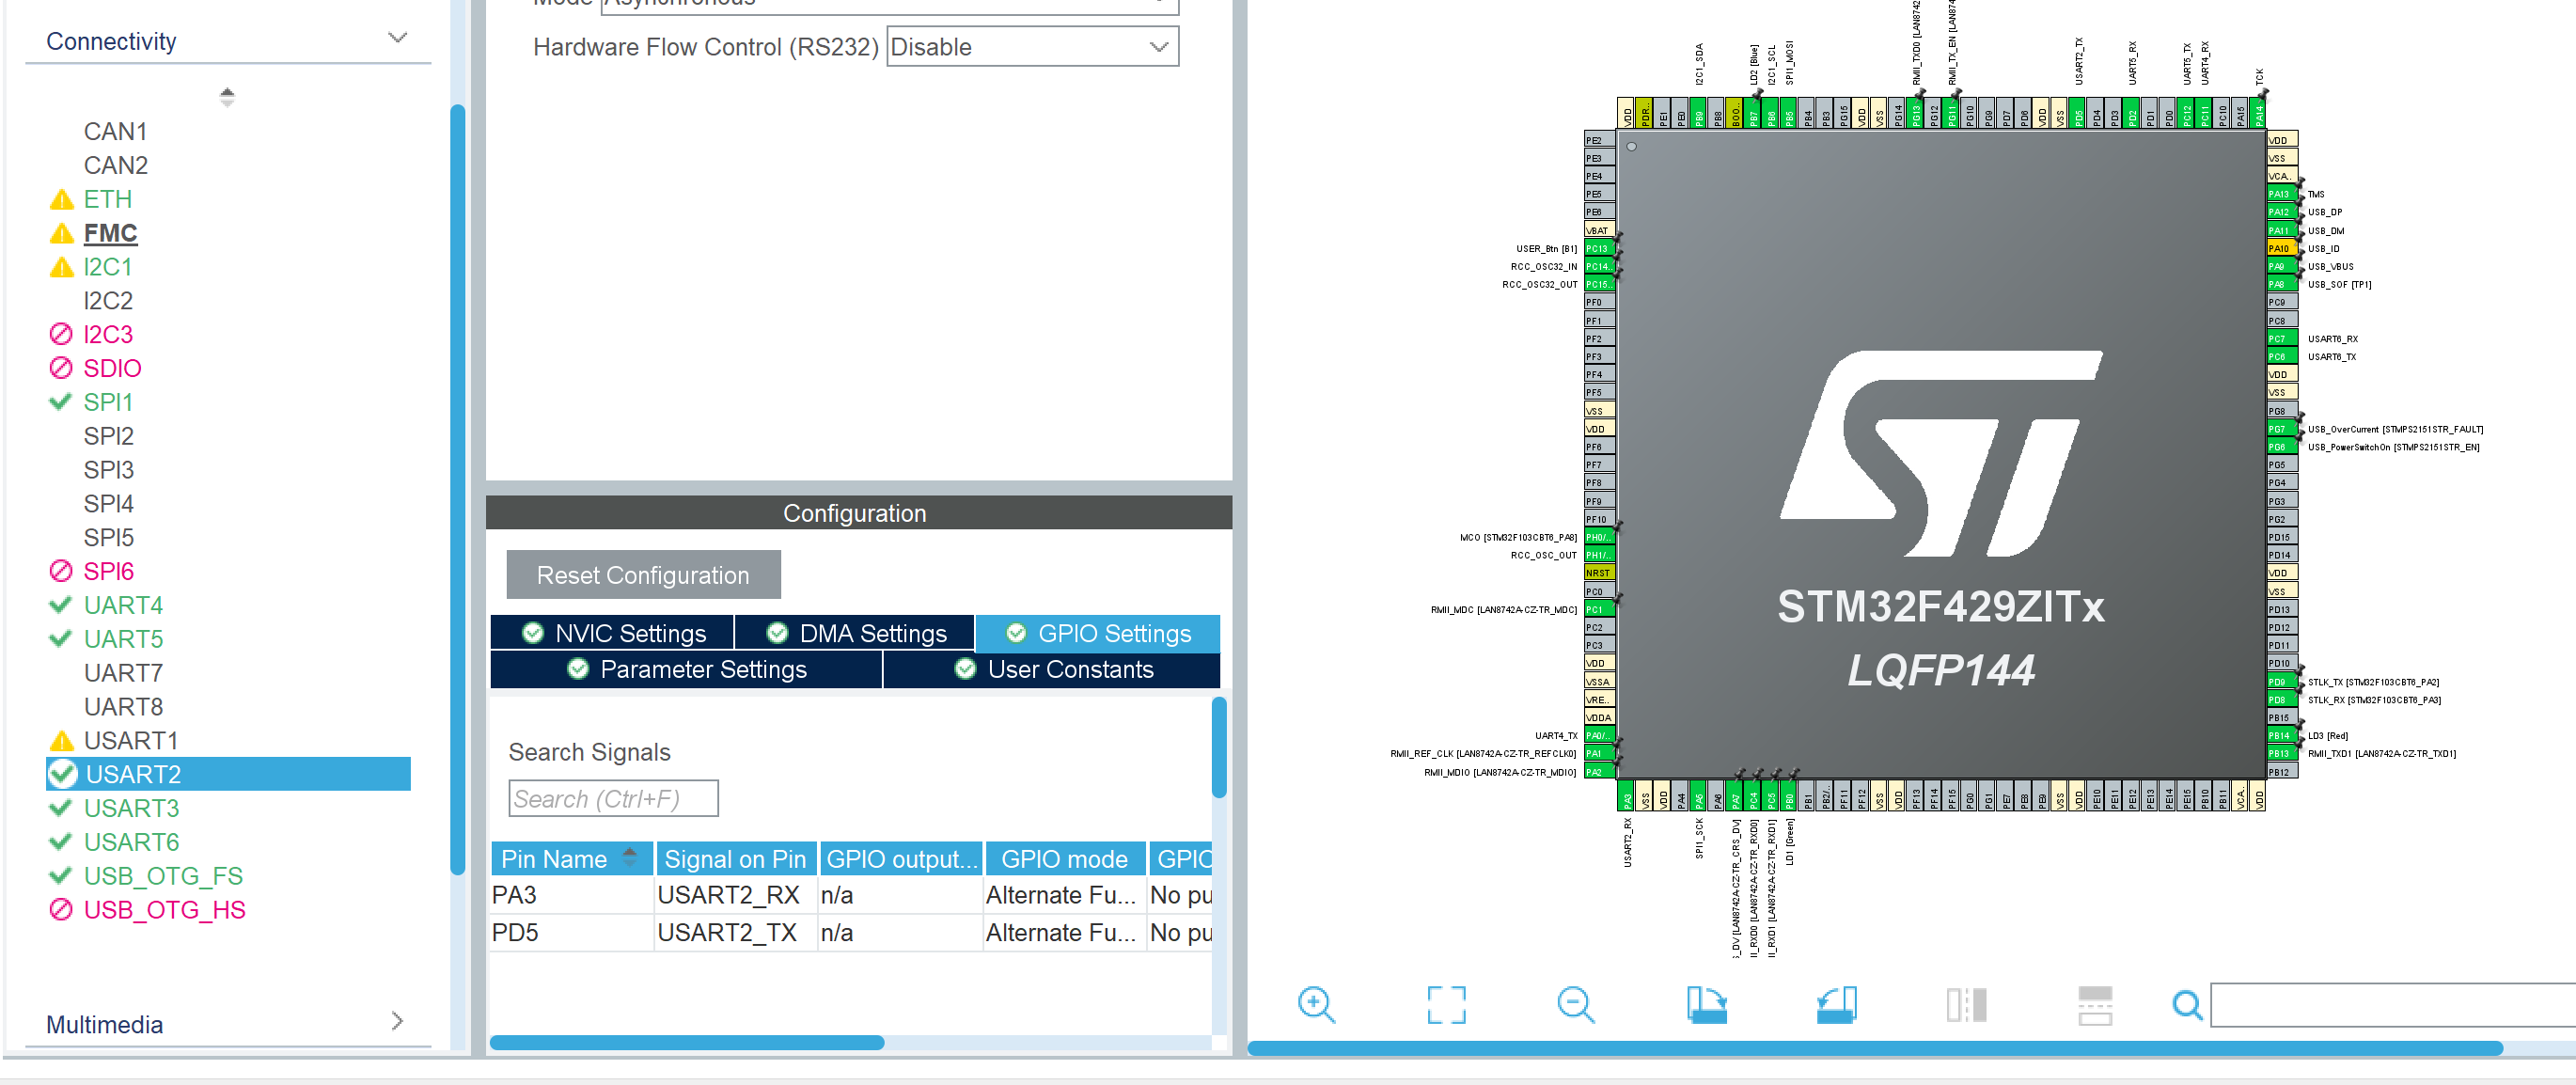
It's time to send the data to the STM32 from the XIAO, for that purpose I used the UART (Universal Asynchronous Receiver-Transmitter) method. By Inspecting the datasheet there are a lot of Hardware serial available for the STM32 Nucleo. Here I used the USART2. PA3 and PD5 pins will be used for RX and TX,
So I will write the code in a way that, XIAO will send the character 'C' if it detects a Hand raising and will send the character 'A' if it detects any anomaly movements.
Real-Time Operating System(RTOS)
A Real-Time Operating System (RTOS) is a software component that provides multitasking capabilities for embedded systems. It allows multiple tasks to run concurrently, each with its own priorities and execution times, while maintaining deterministic timing behaviour.
Incorporating the Real-Time Operating System (RTOS) into my telemedicine project has revolutionized its efficiency and responsiveness. By strategically dividing the project into distinct tasks and assigning appropriate priorities, the RTOS ensures that critical functions, such as SpO2 measurement, ECG reading, XIAO serial data retrieval, and sending data to the cloud are seamlessly executed without contention.
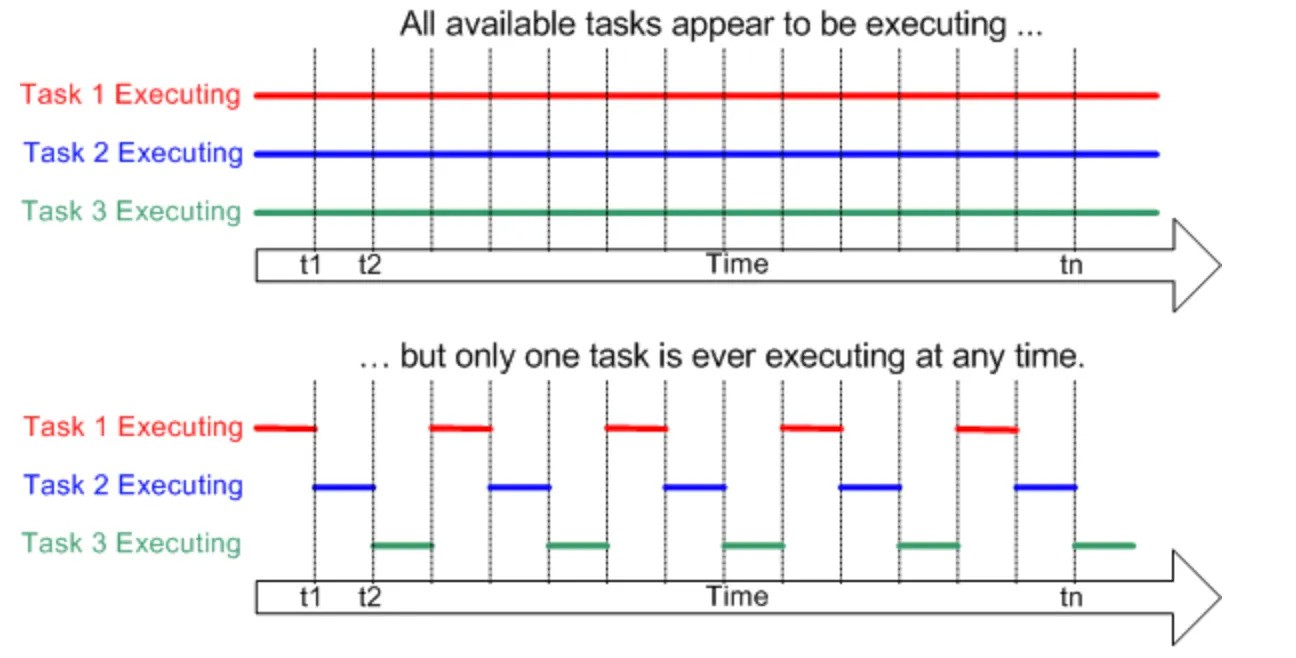
The kernel is the core component of the operating system. Operating systems like Linux use a kernel, allowing users to access the computer at the same time. Each program being executed is a task (or thread) under the control of the operating system. If an operating system can perform multiple tasks in this way, it can be said to be multitasking.
Traditional processors can only execute one task at a time, but a multitasking operating system can make each task appear to be executed simultaneously by quickly switching between tasks. The following figure shows the relationship between the execution mode of three tasks and time.
Here are some concepts of RTOS.
- Task: A task is a basic unit of execution in an RTOS. Each task represents a distinct activity that runs independently.
- Task Scheduling: The RTOS scheduler determines the order and timing of task execution based on task priorities and scheduling policies.
- Priority Management: Tasks are assigned priorities to control their execution order. Higher-priority tasks preempt lower-priority tasks.
- Semaphores: Semaphores are synchronization mechanisms used to manage access to shared resources among tasks.
- Mutexes: Mutexes are used to provide exclusive access to resources, preventing conflicts and data corruption.
- Queues: Queues facilitate communication between tasks, allowing data to be passed in a structured manner.
In this project, I will create three tasks
- Reading ECG data and sending it to the cloud
- Reading SP02, Heart rate, and temperature and will send it to the cloud
- Reading the serial data from the XIAO BLE sense if there are any movements detected.
Software Development
This is my temporary hardware setup for coding the project.
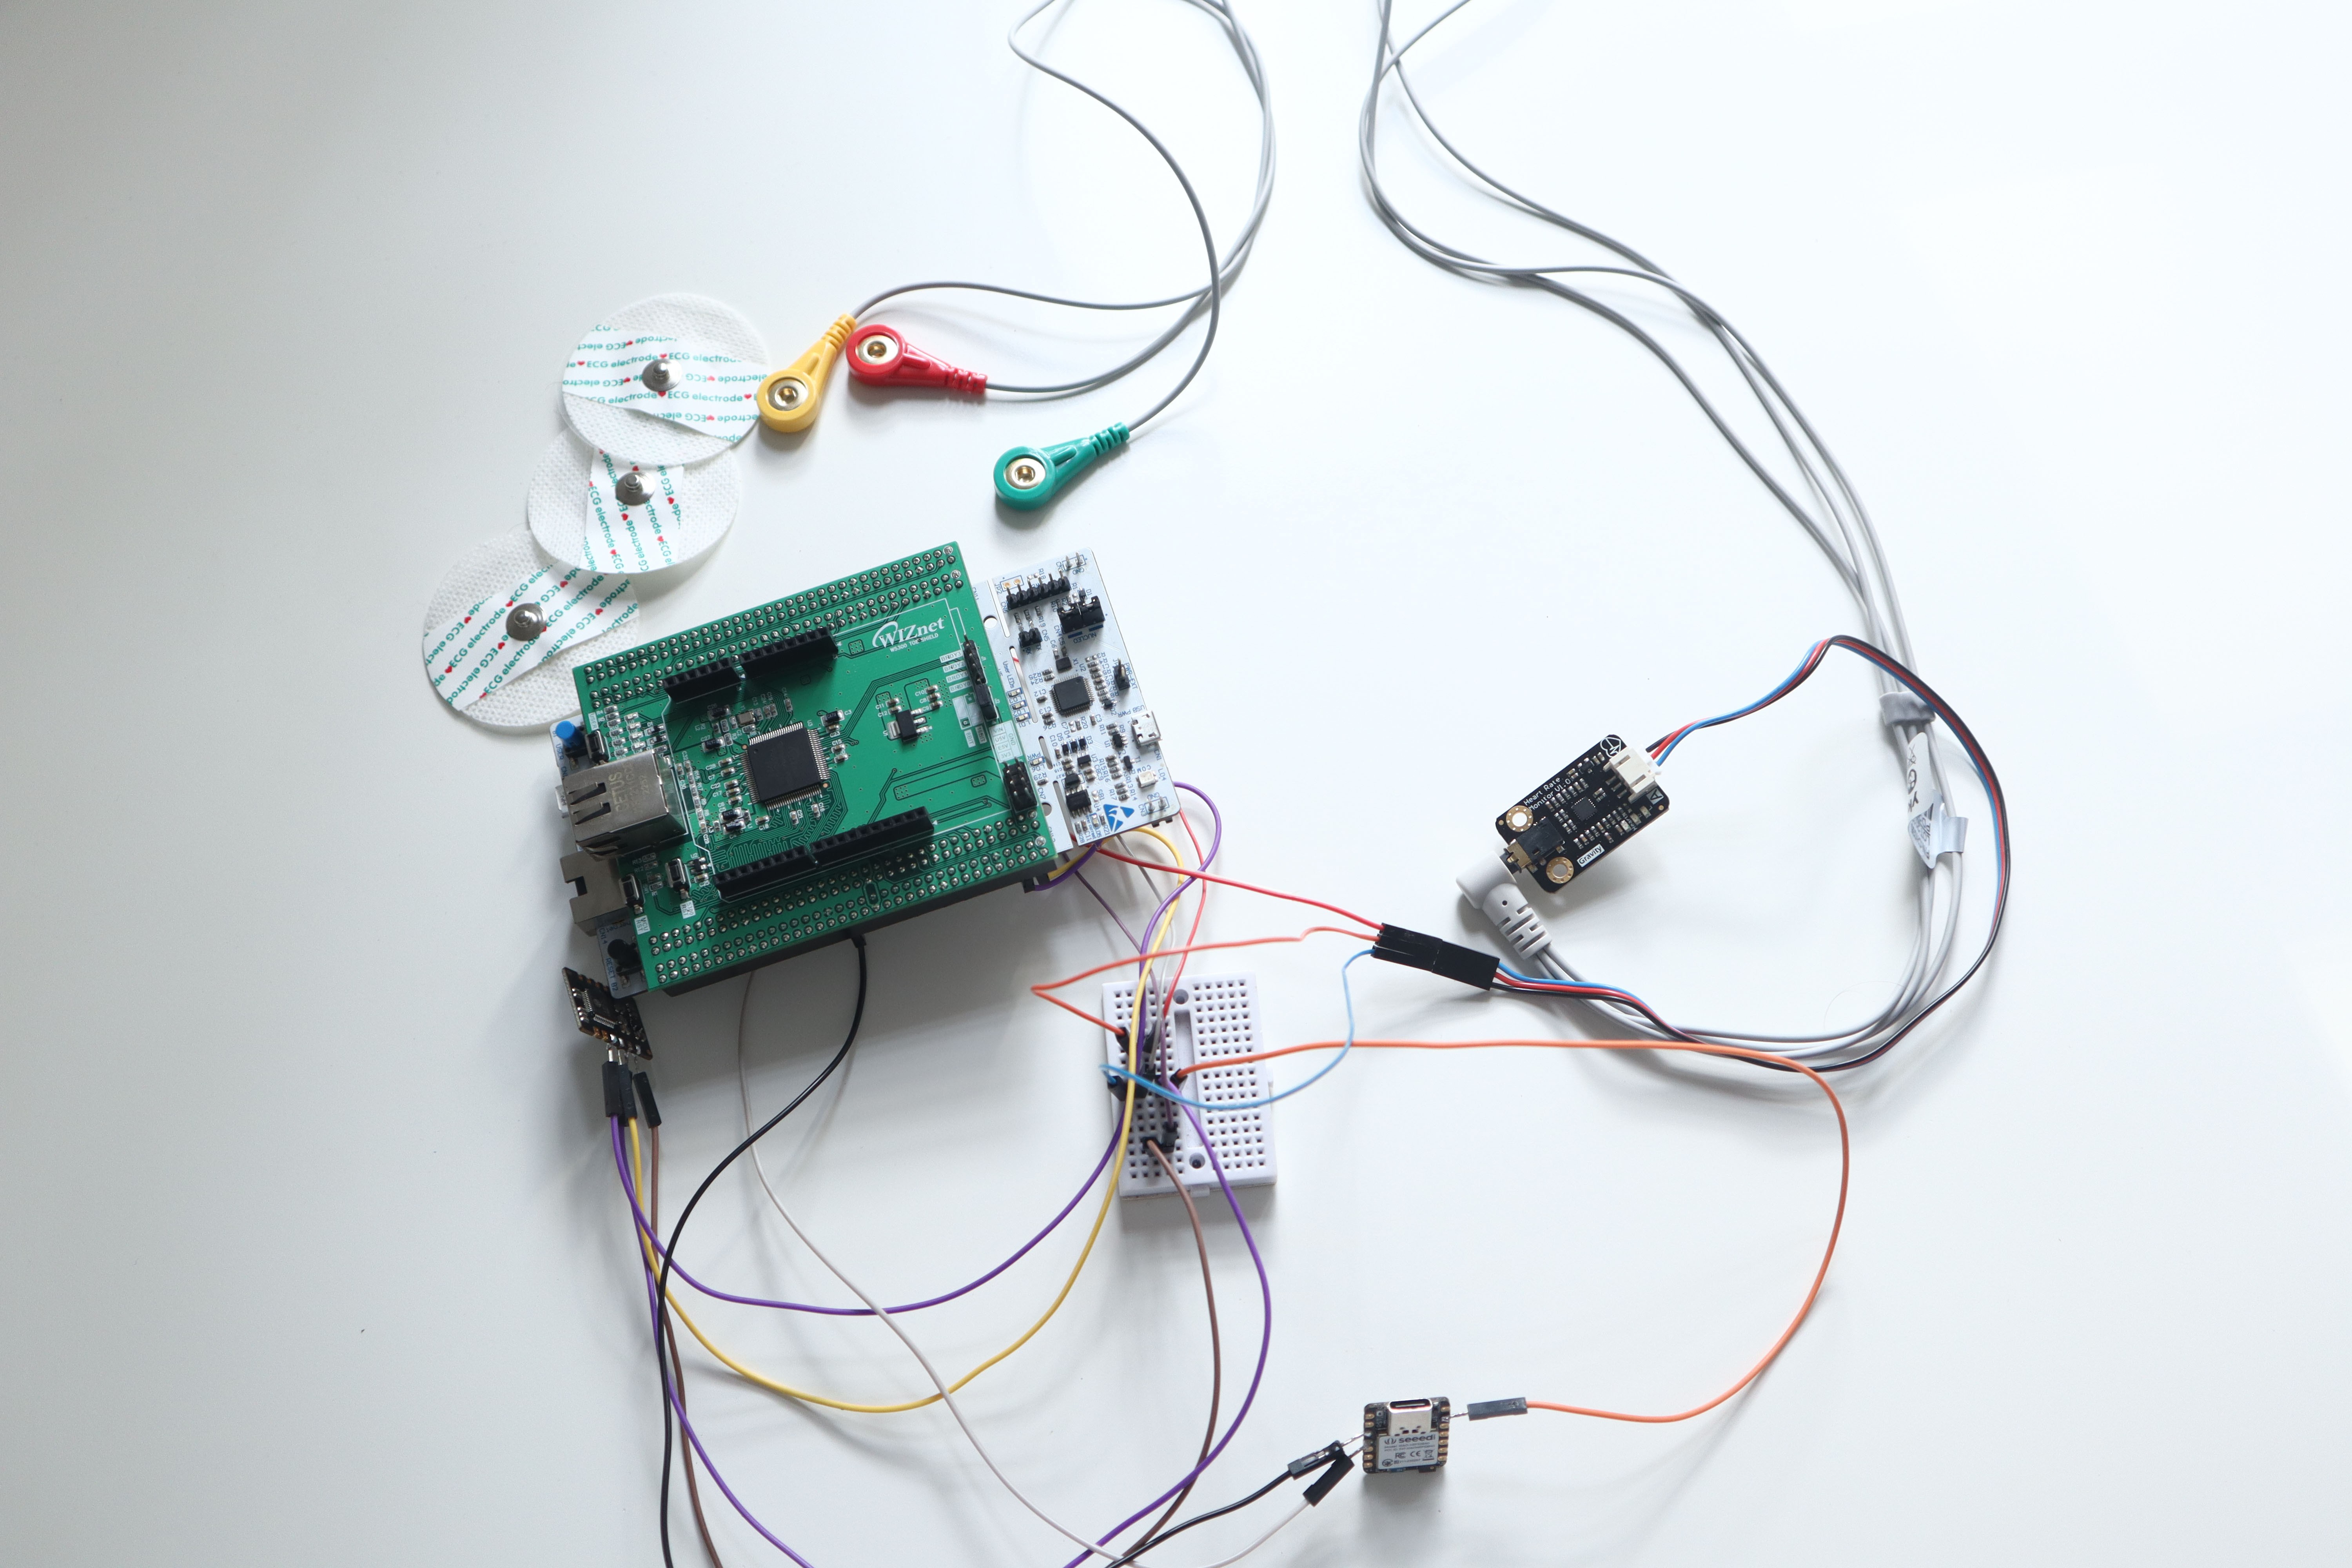
It took me around 10 days to finish the whole code. You can find the entire code in the GitHub repository.
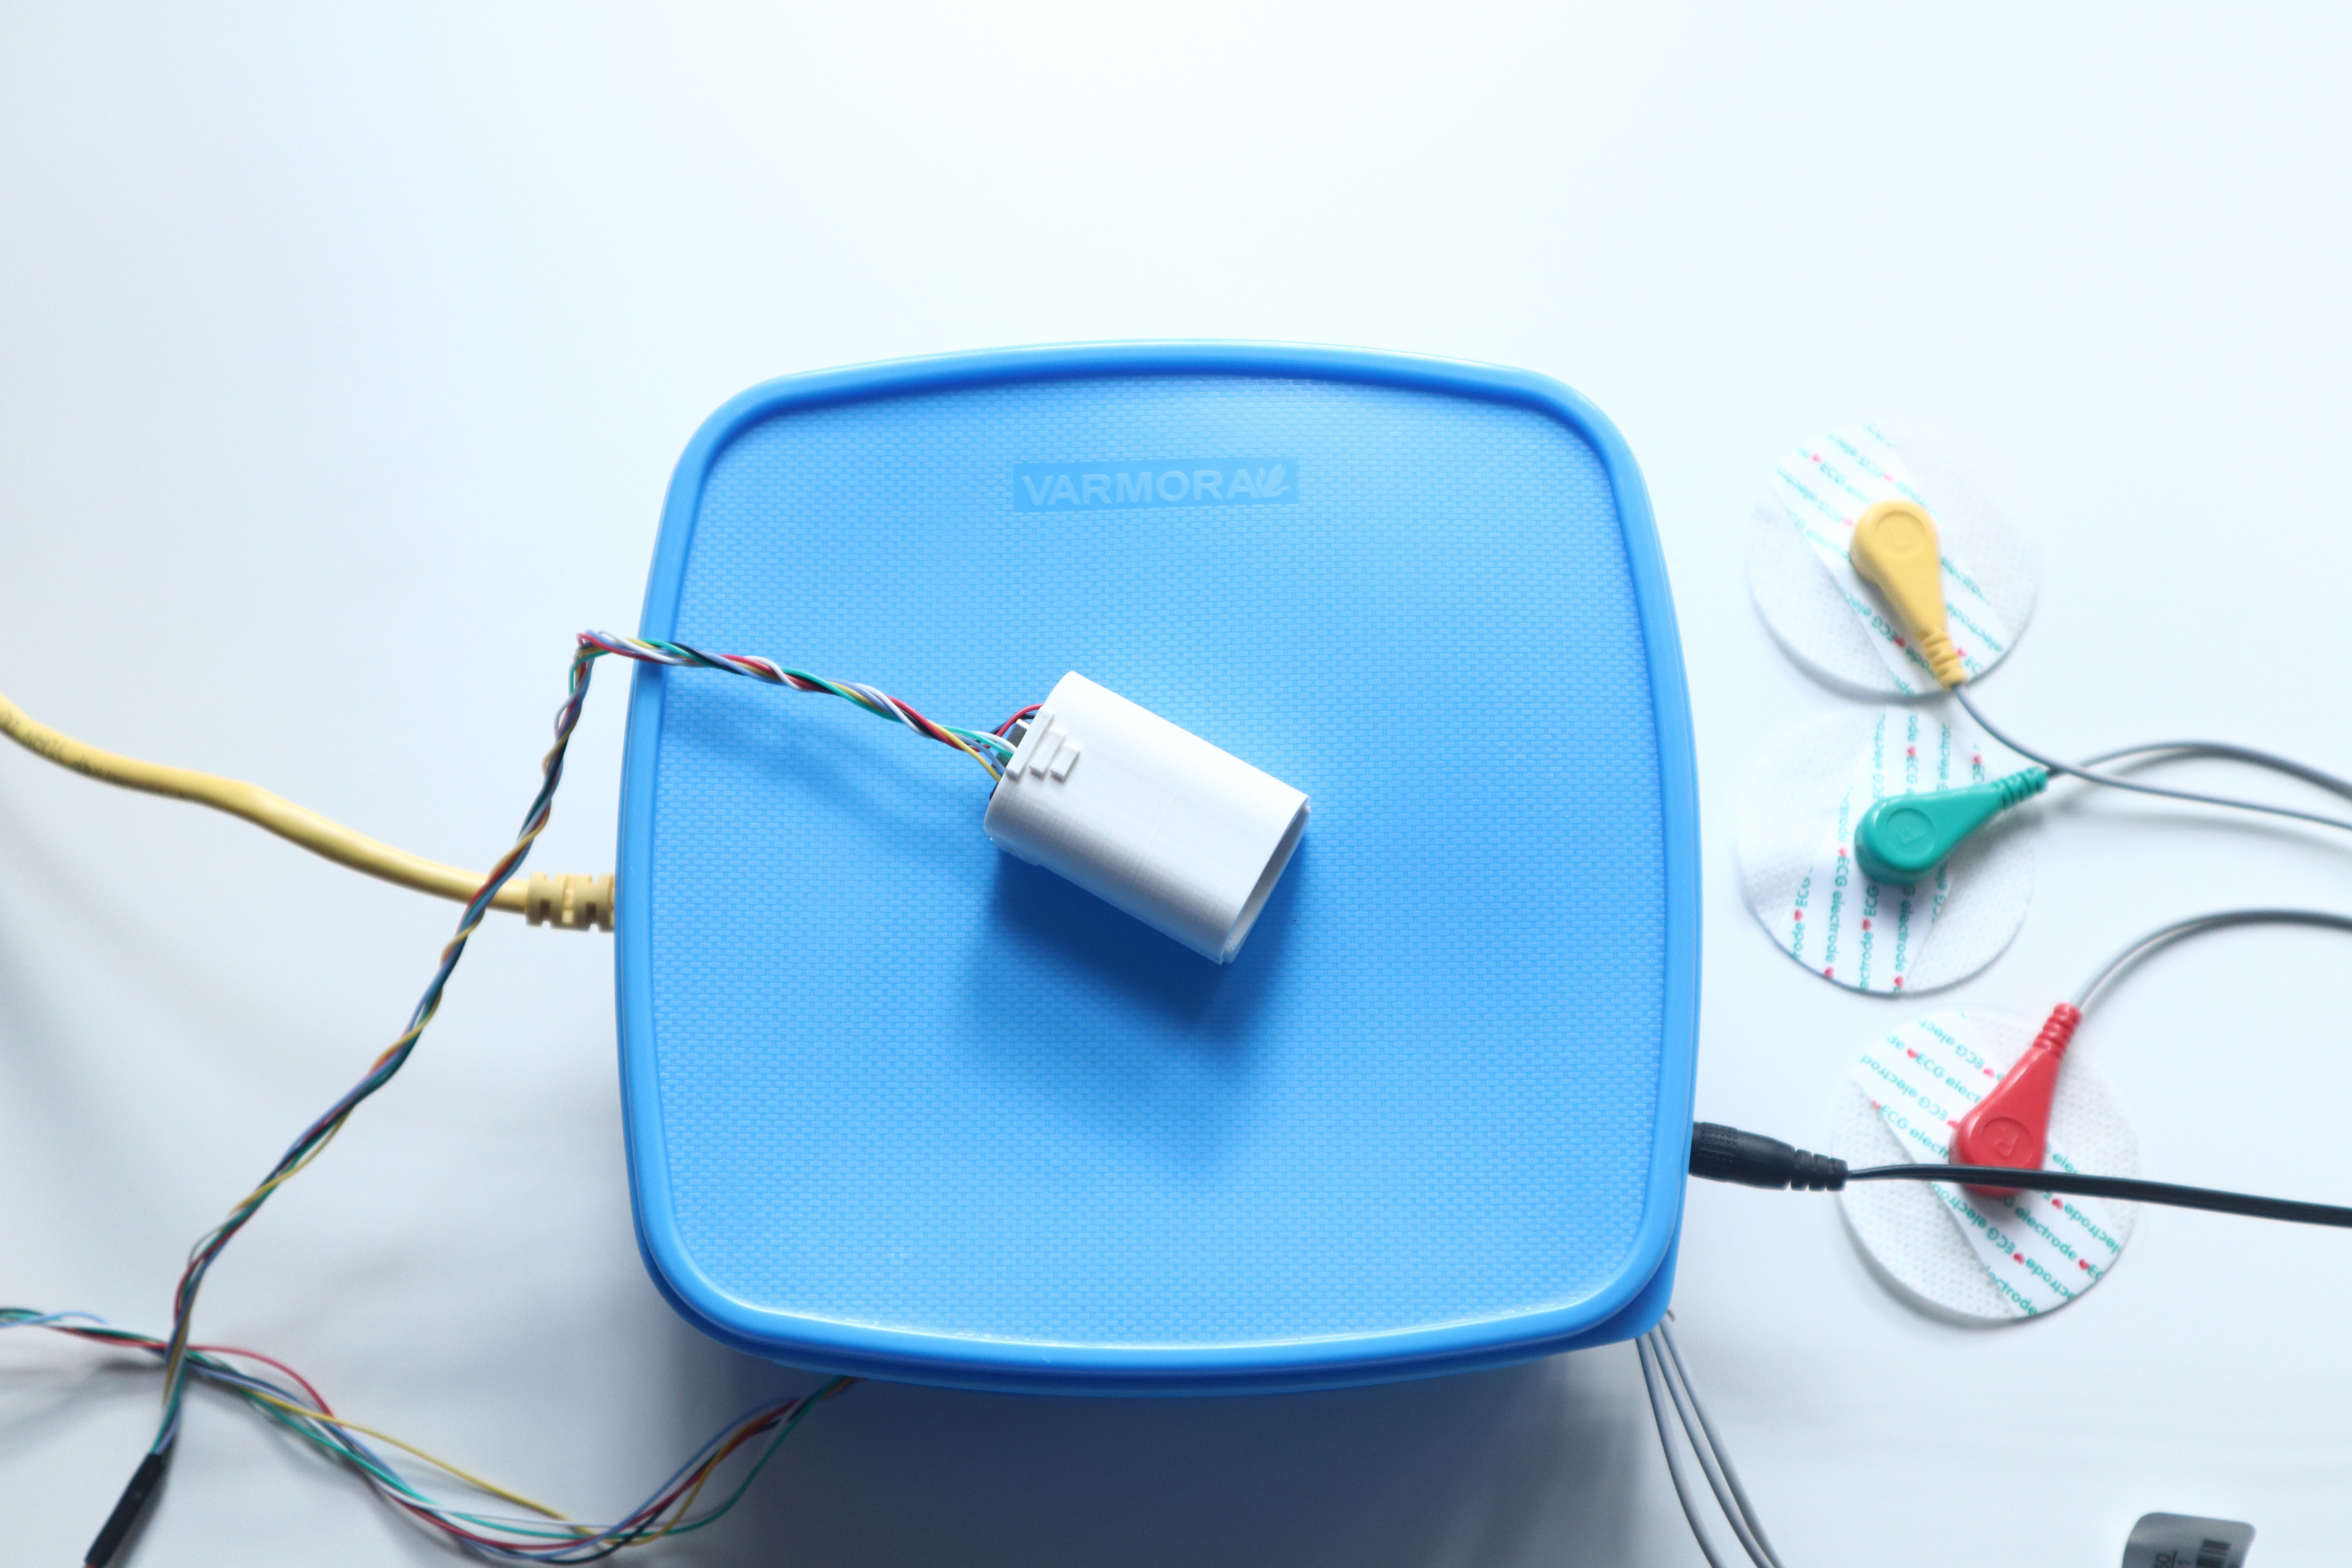
Setting Up The Device
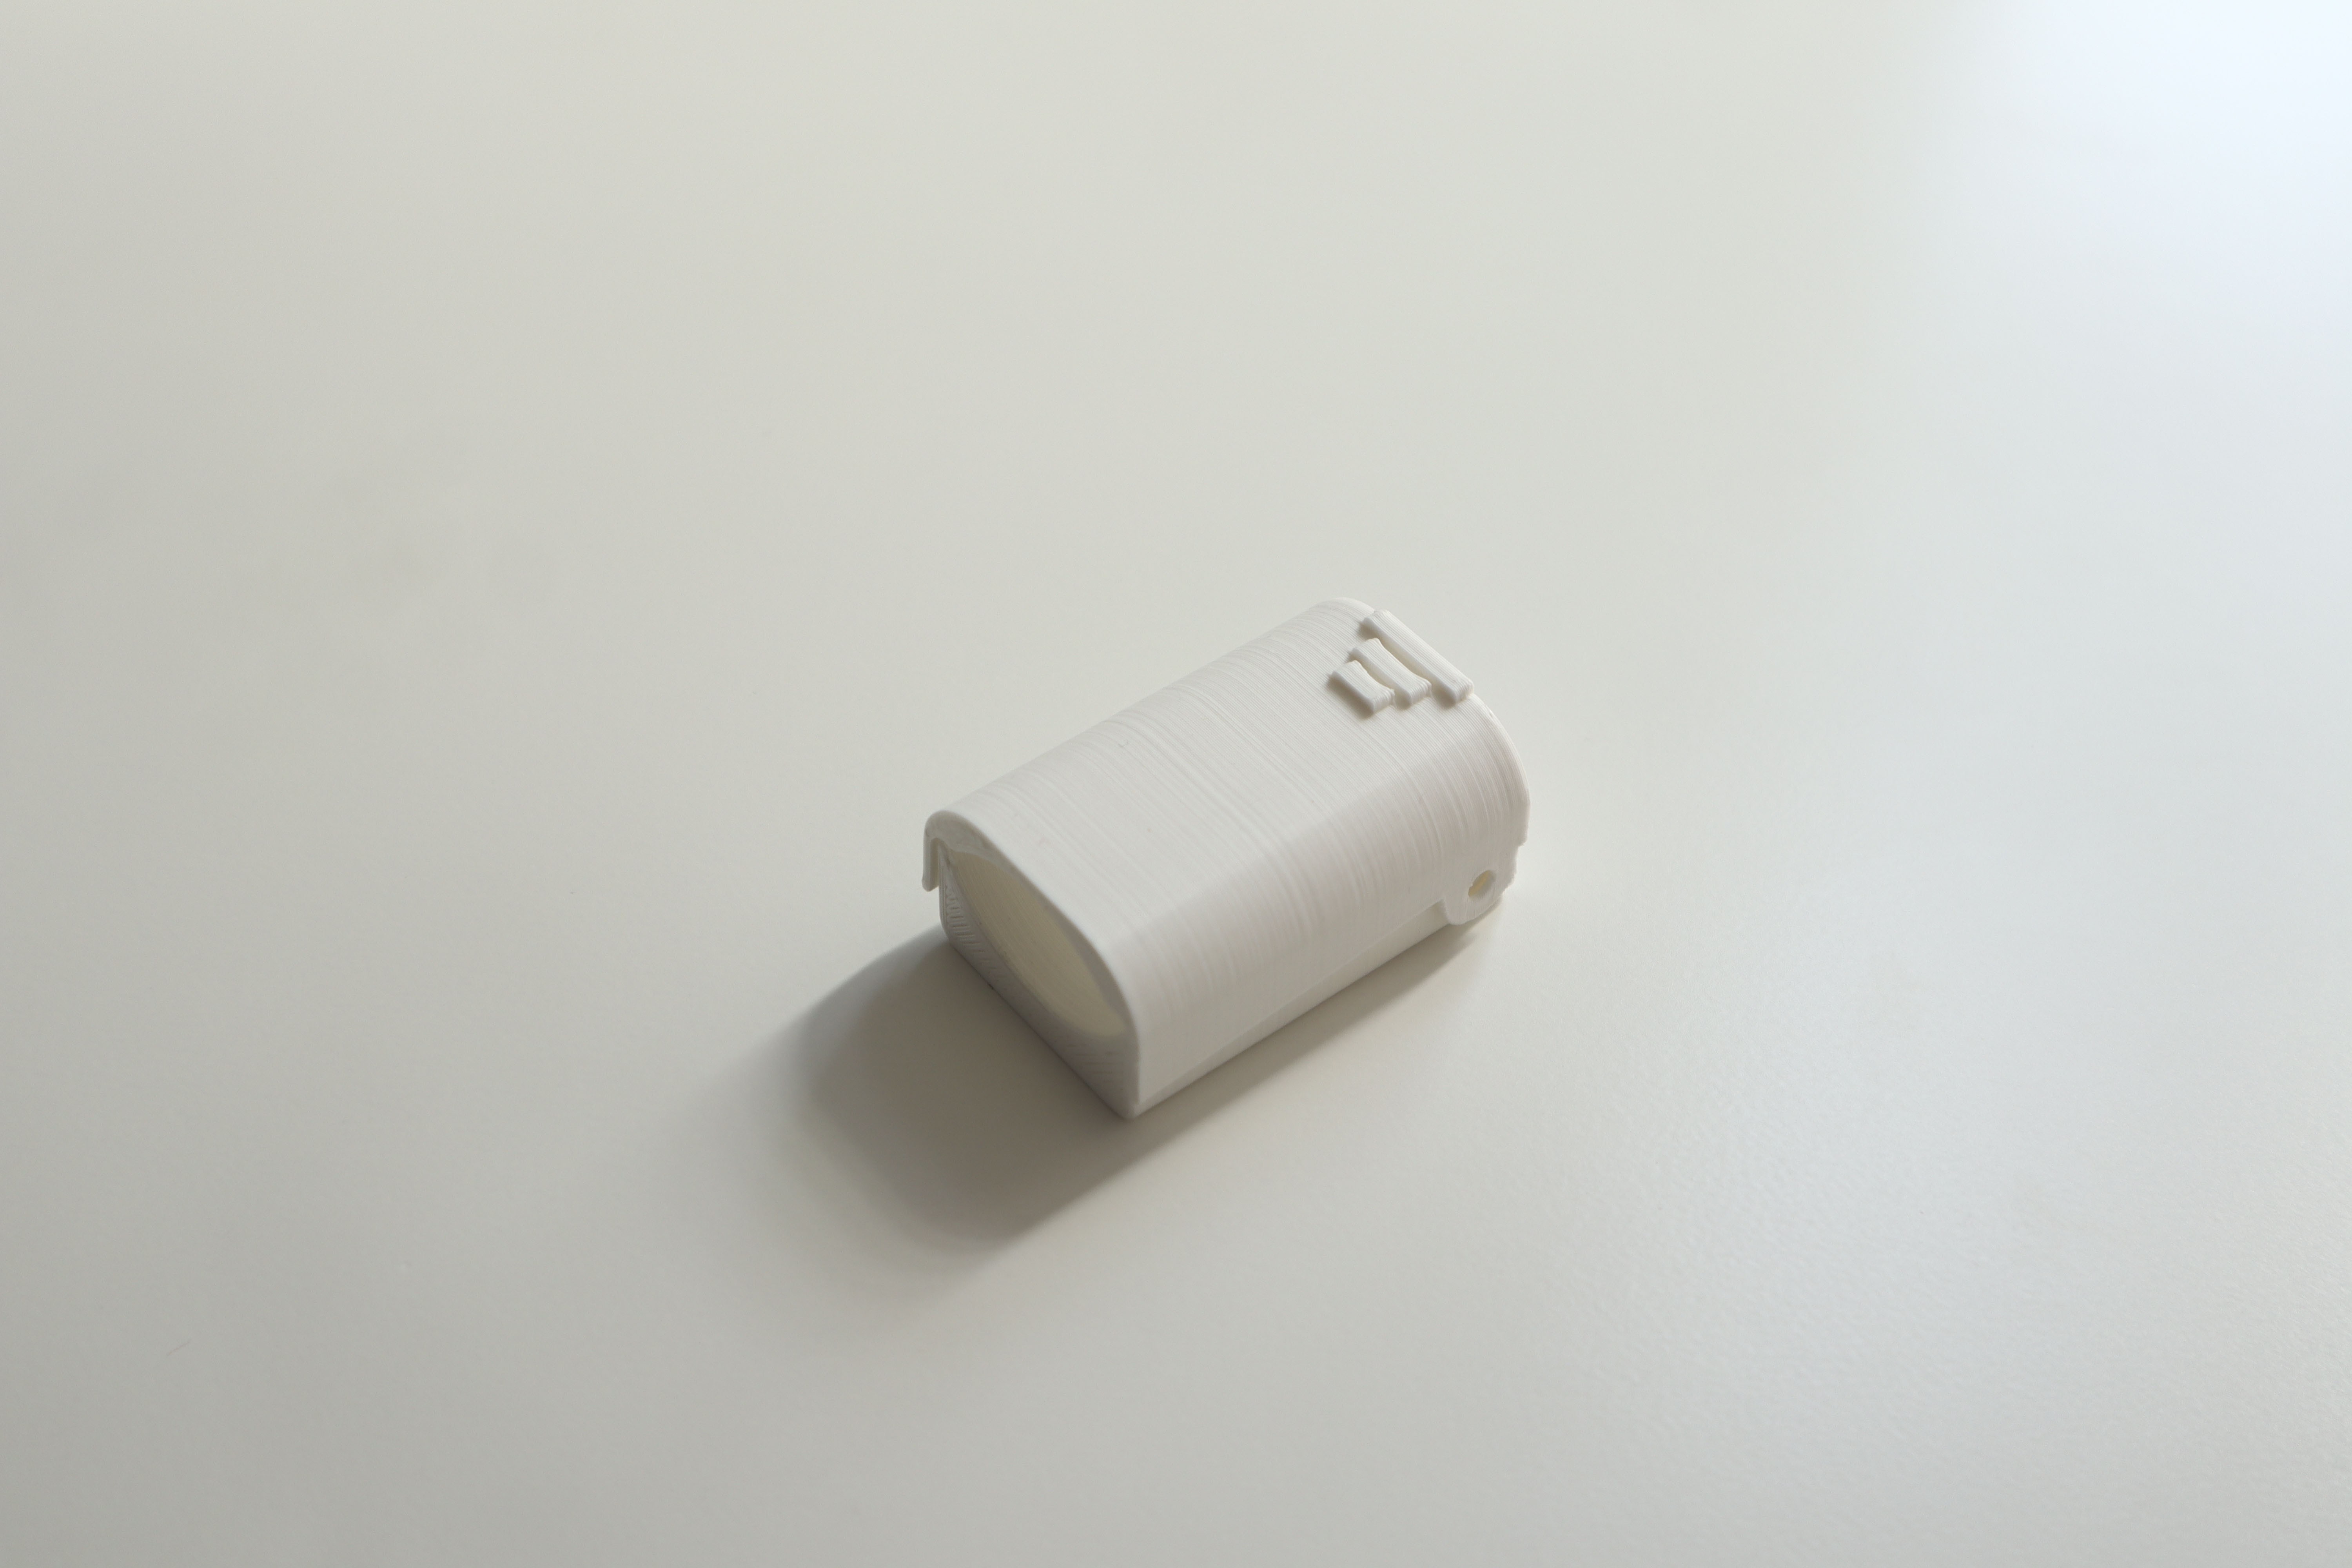
The MAX30102 sensor and the XIAO BLE sense are going to be attached to the finger. So we need a finger clip design in which I can put these things. After long hours of searching, I found a design for this project—great thanks to him.
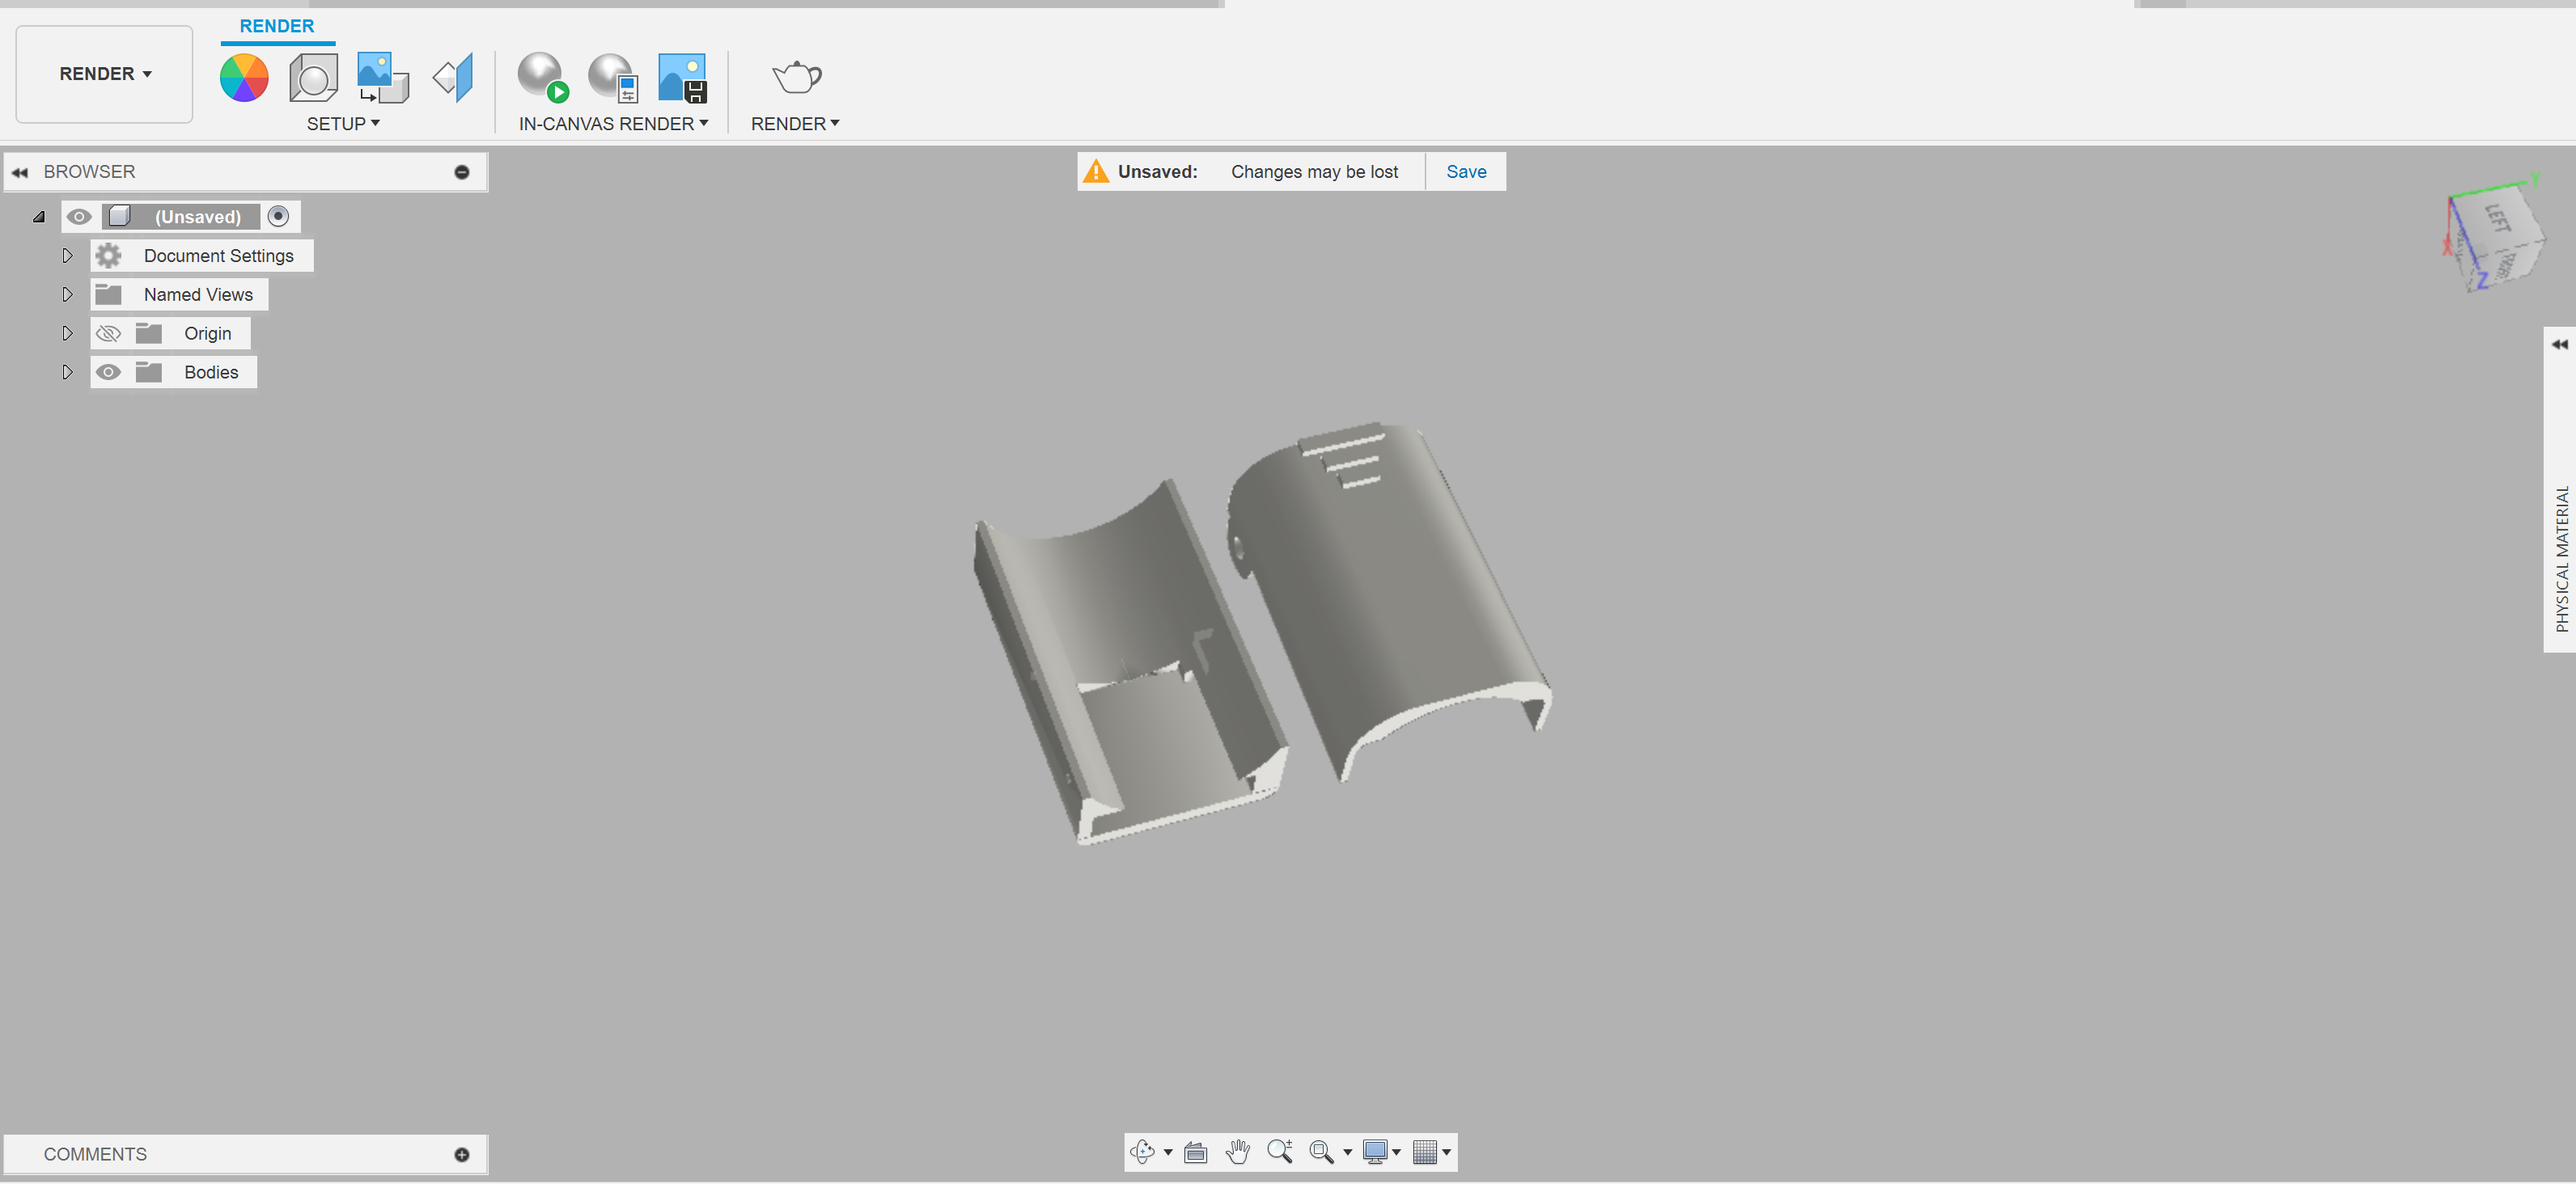
This is the finger clip after printing.

Then I started wiring after securing XIAO and MAX30102 in the finger clip.
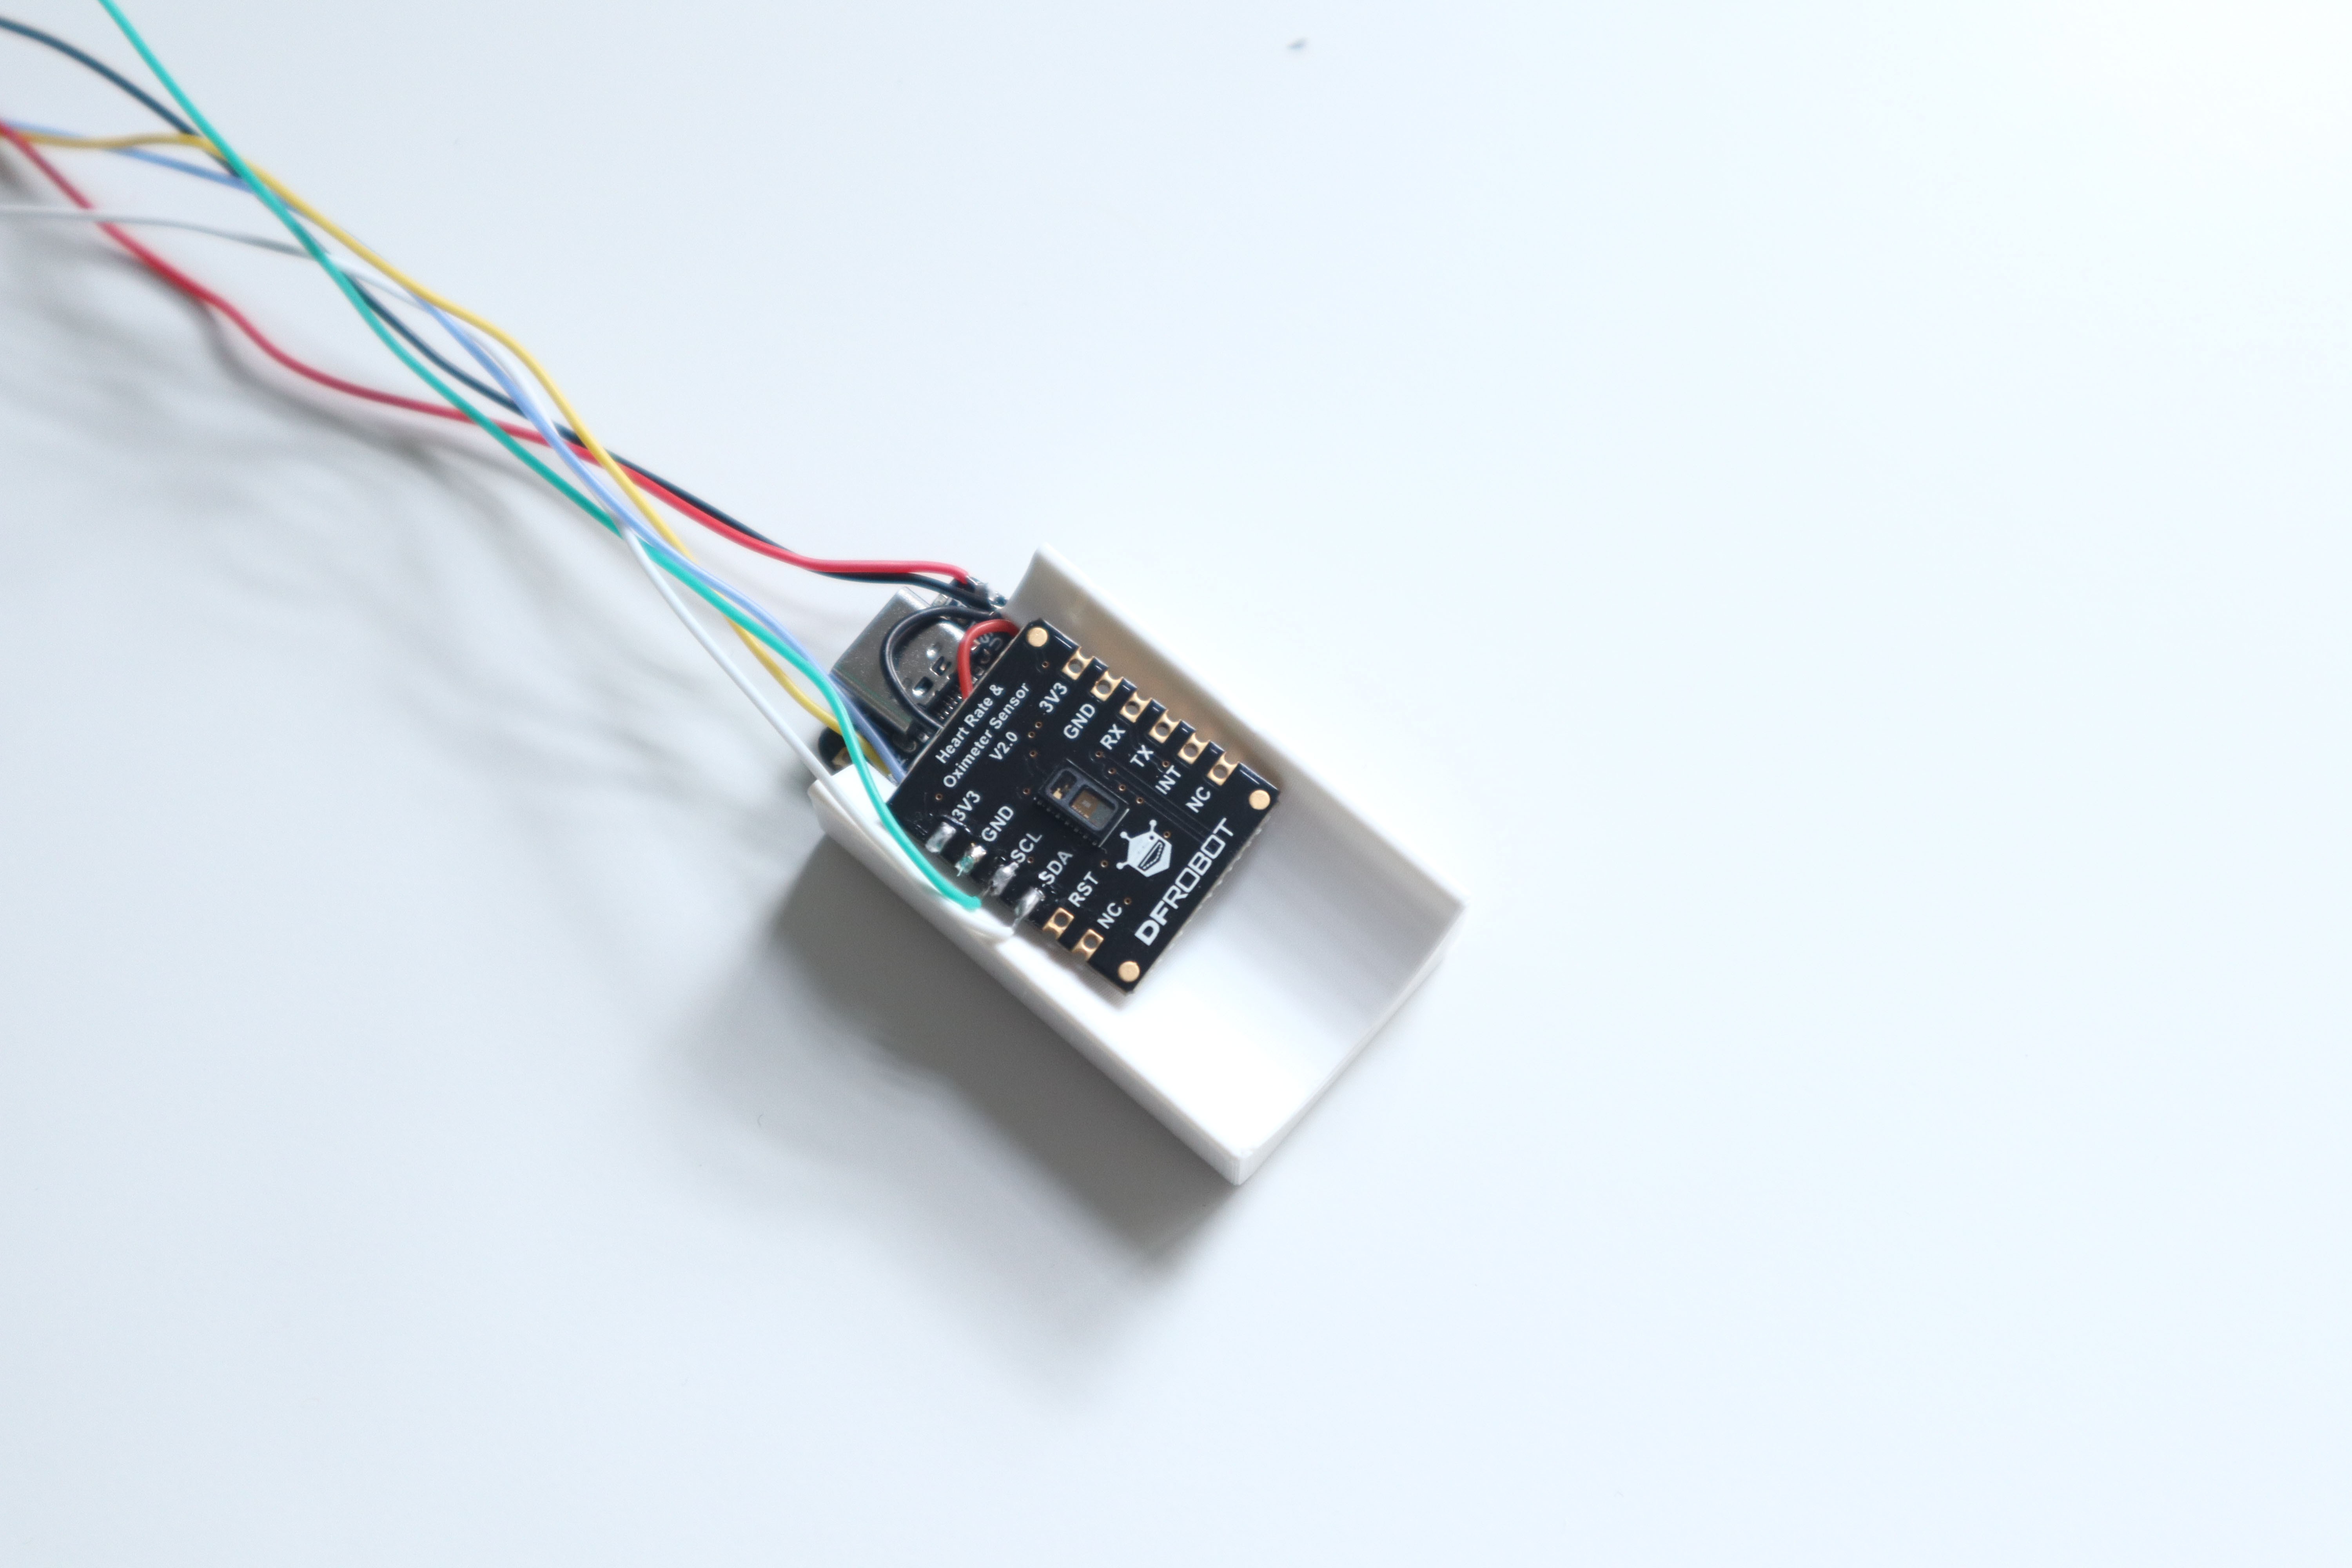
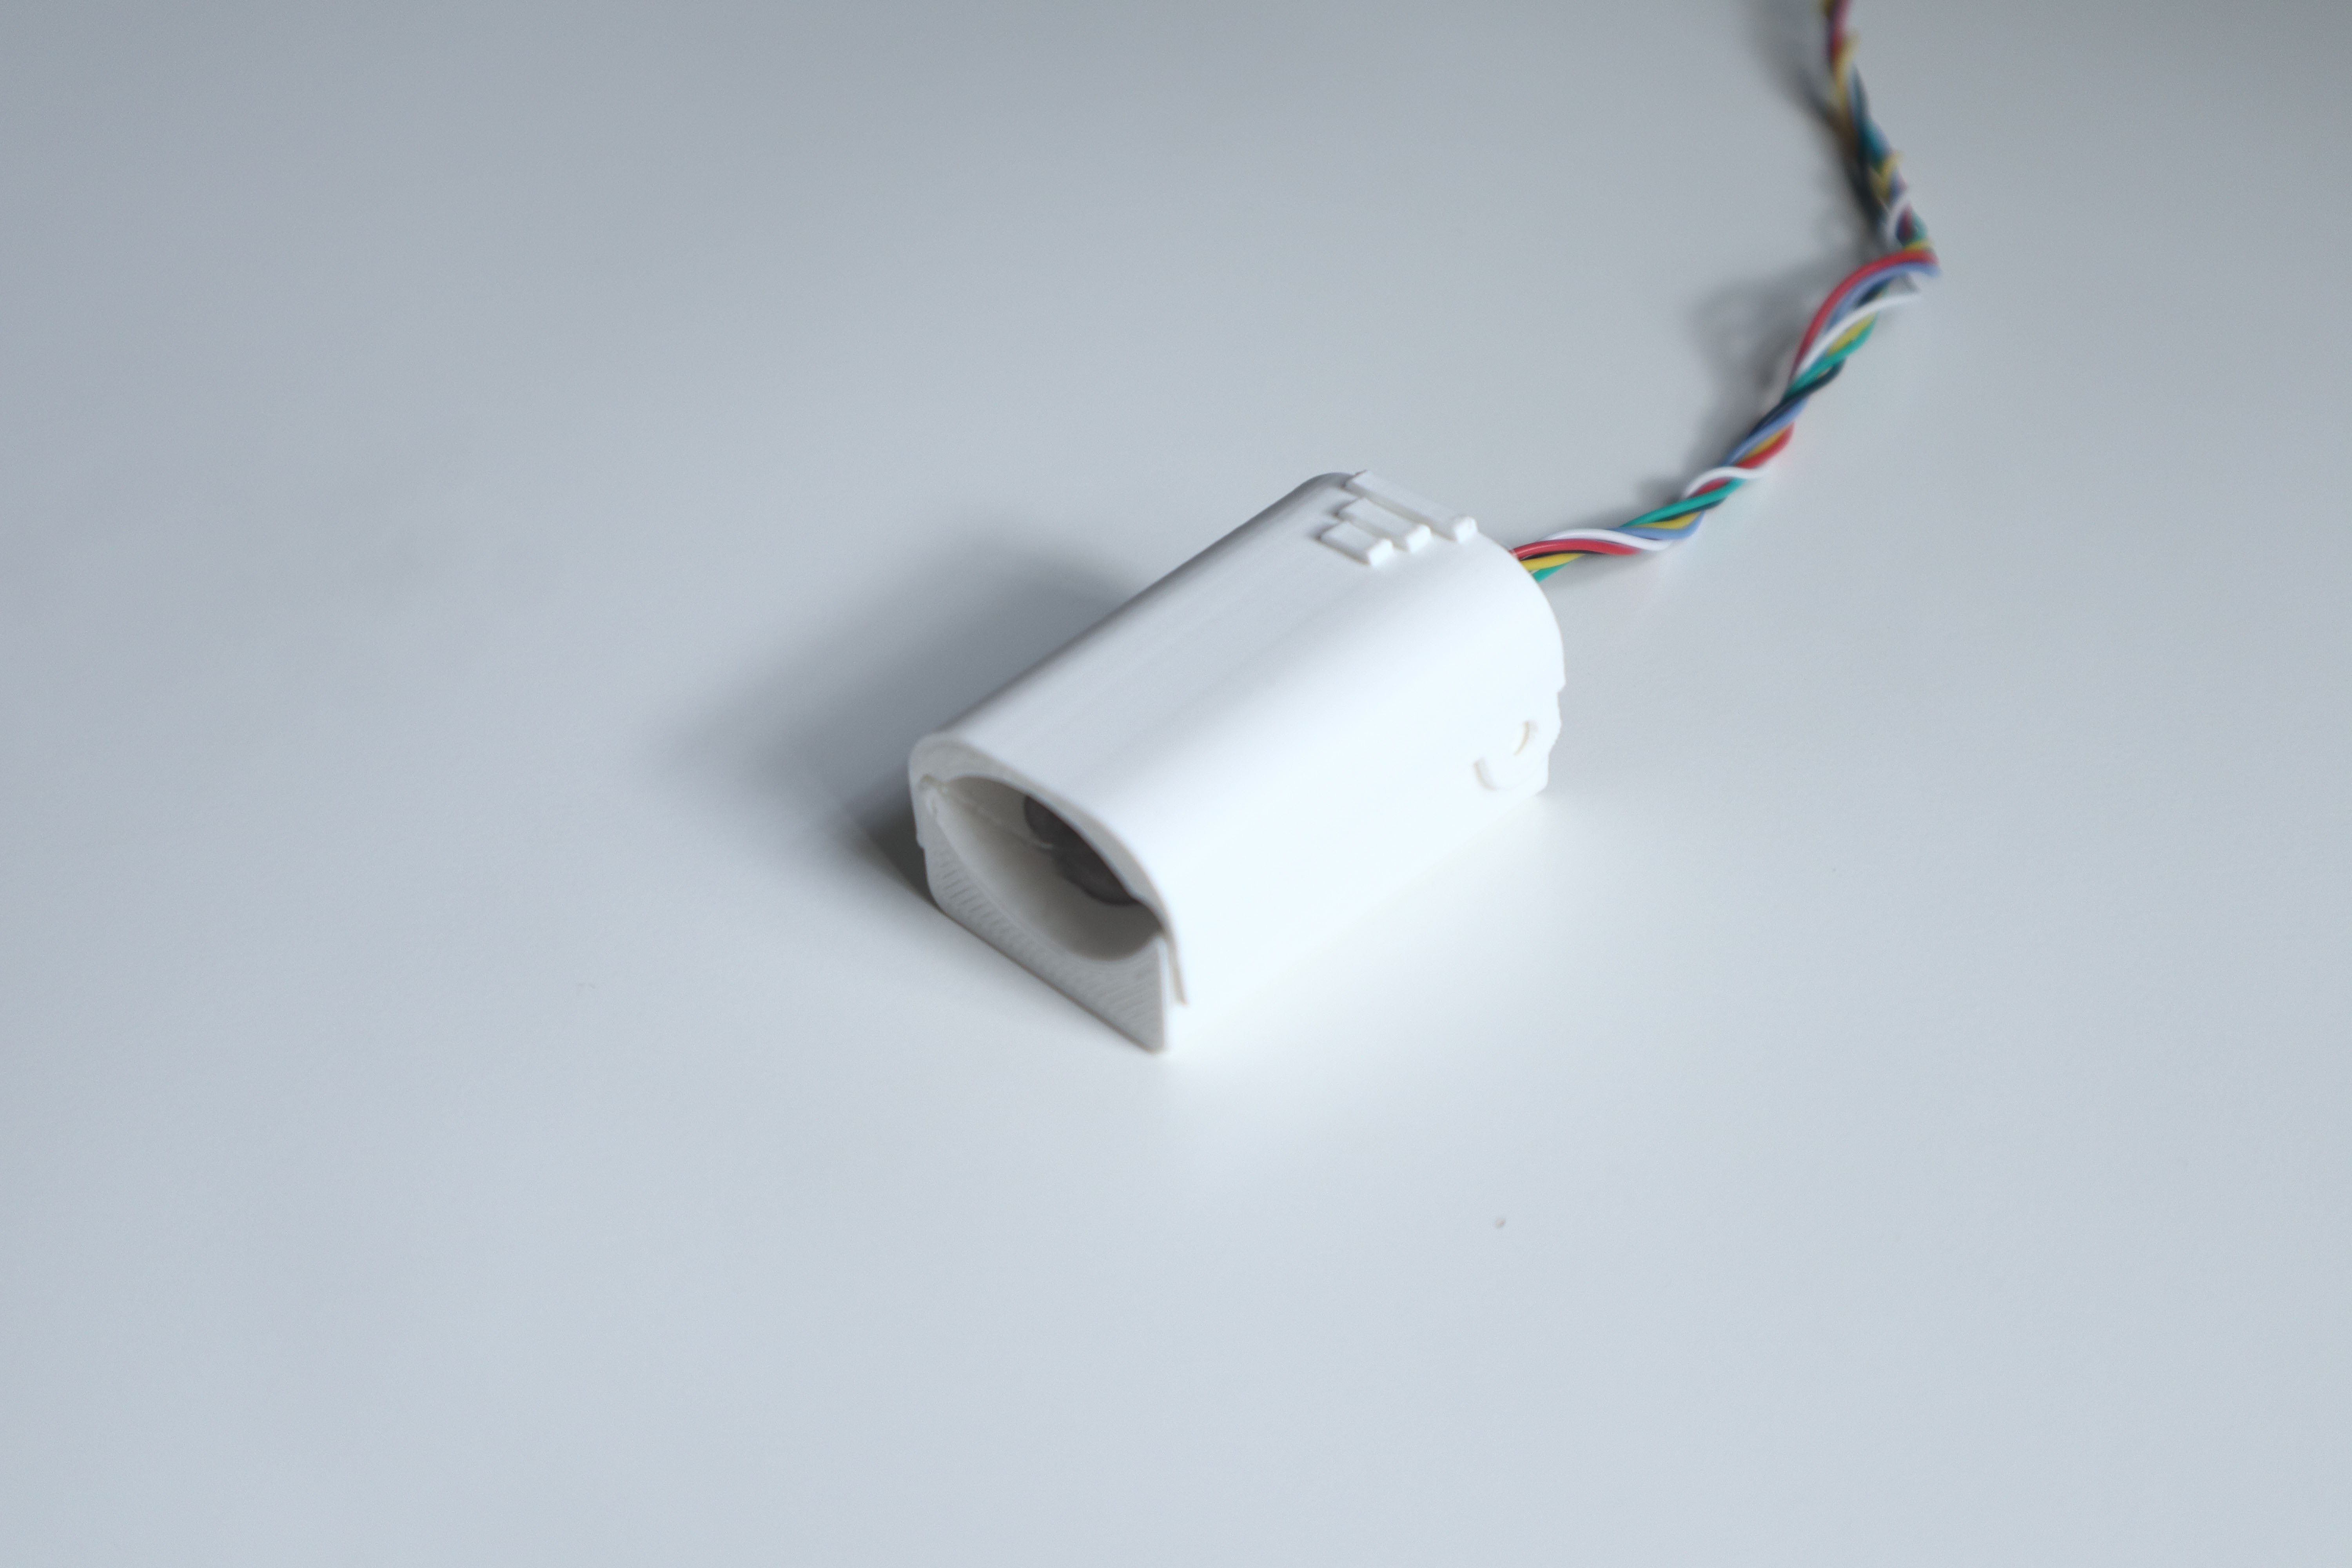
For sake the of convenience I actually twisted the wire.
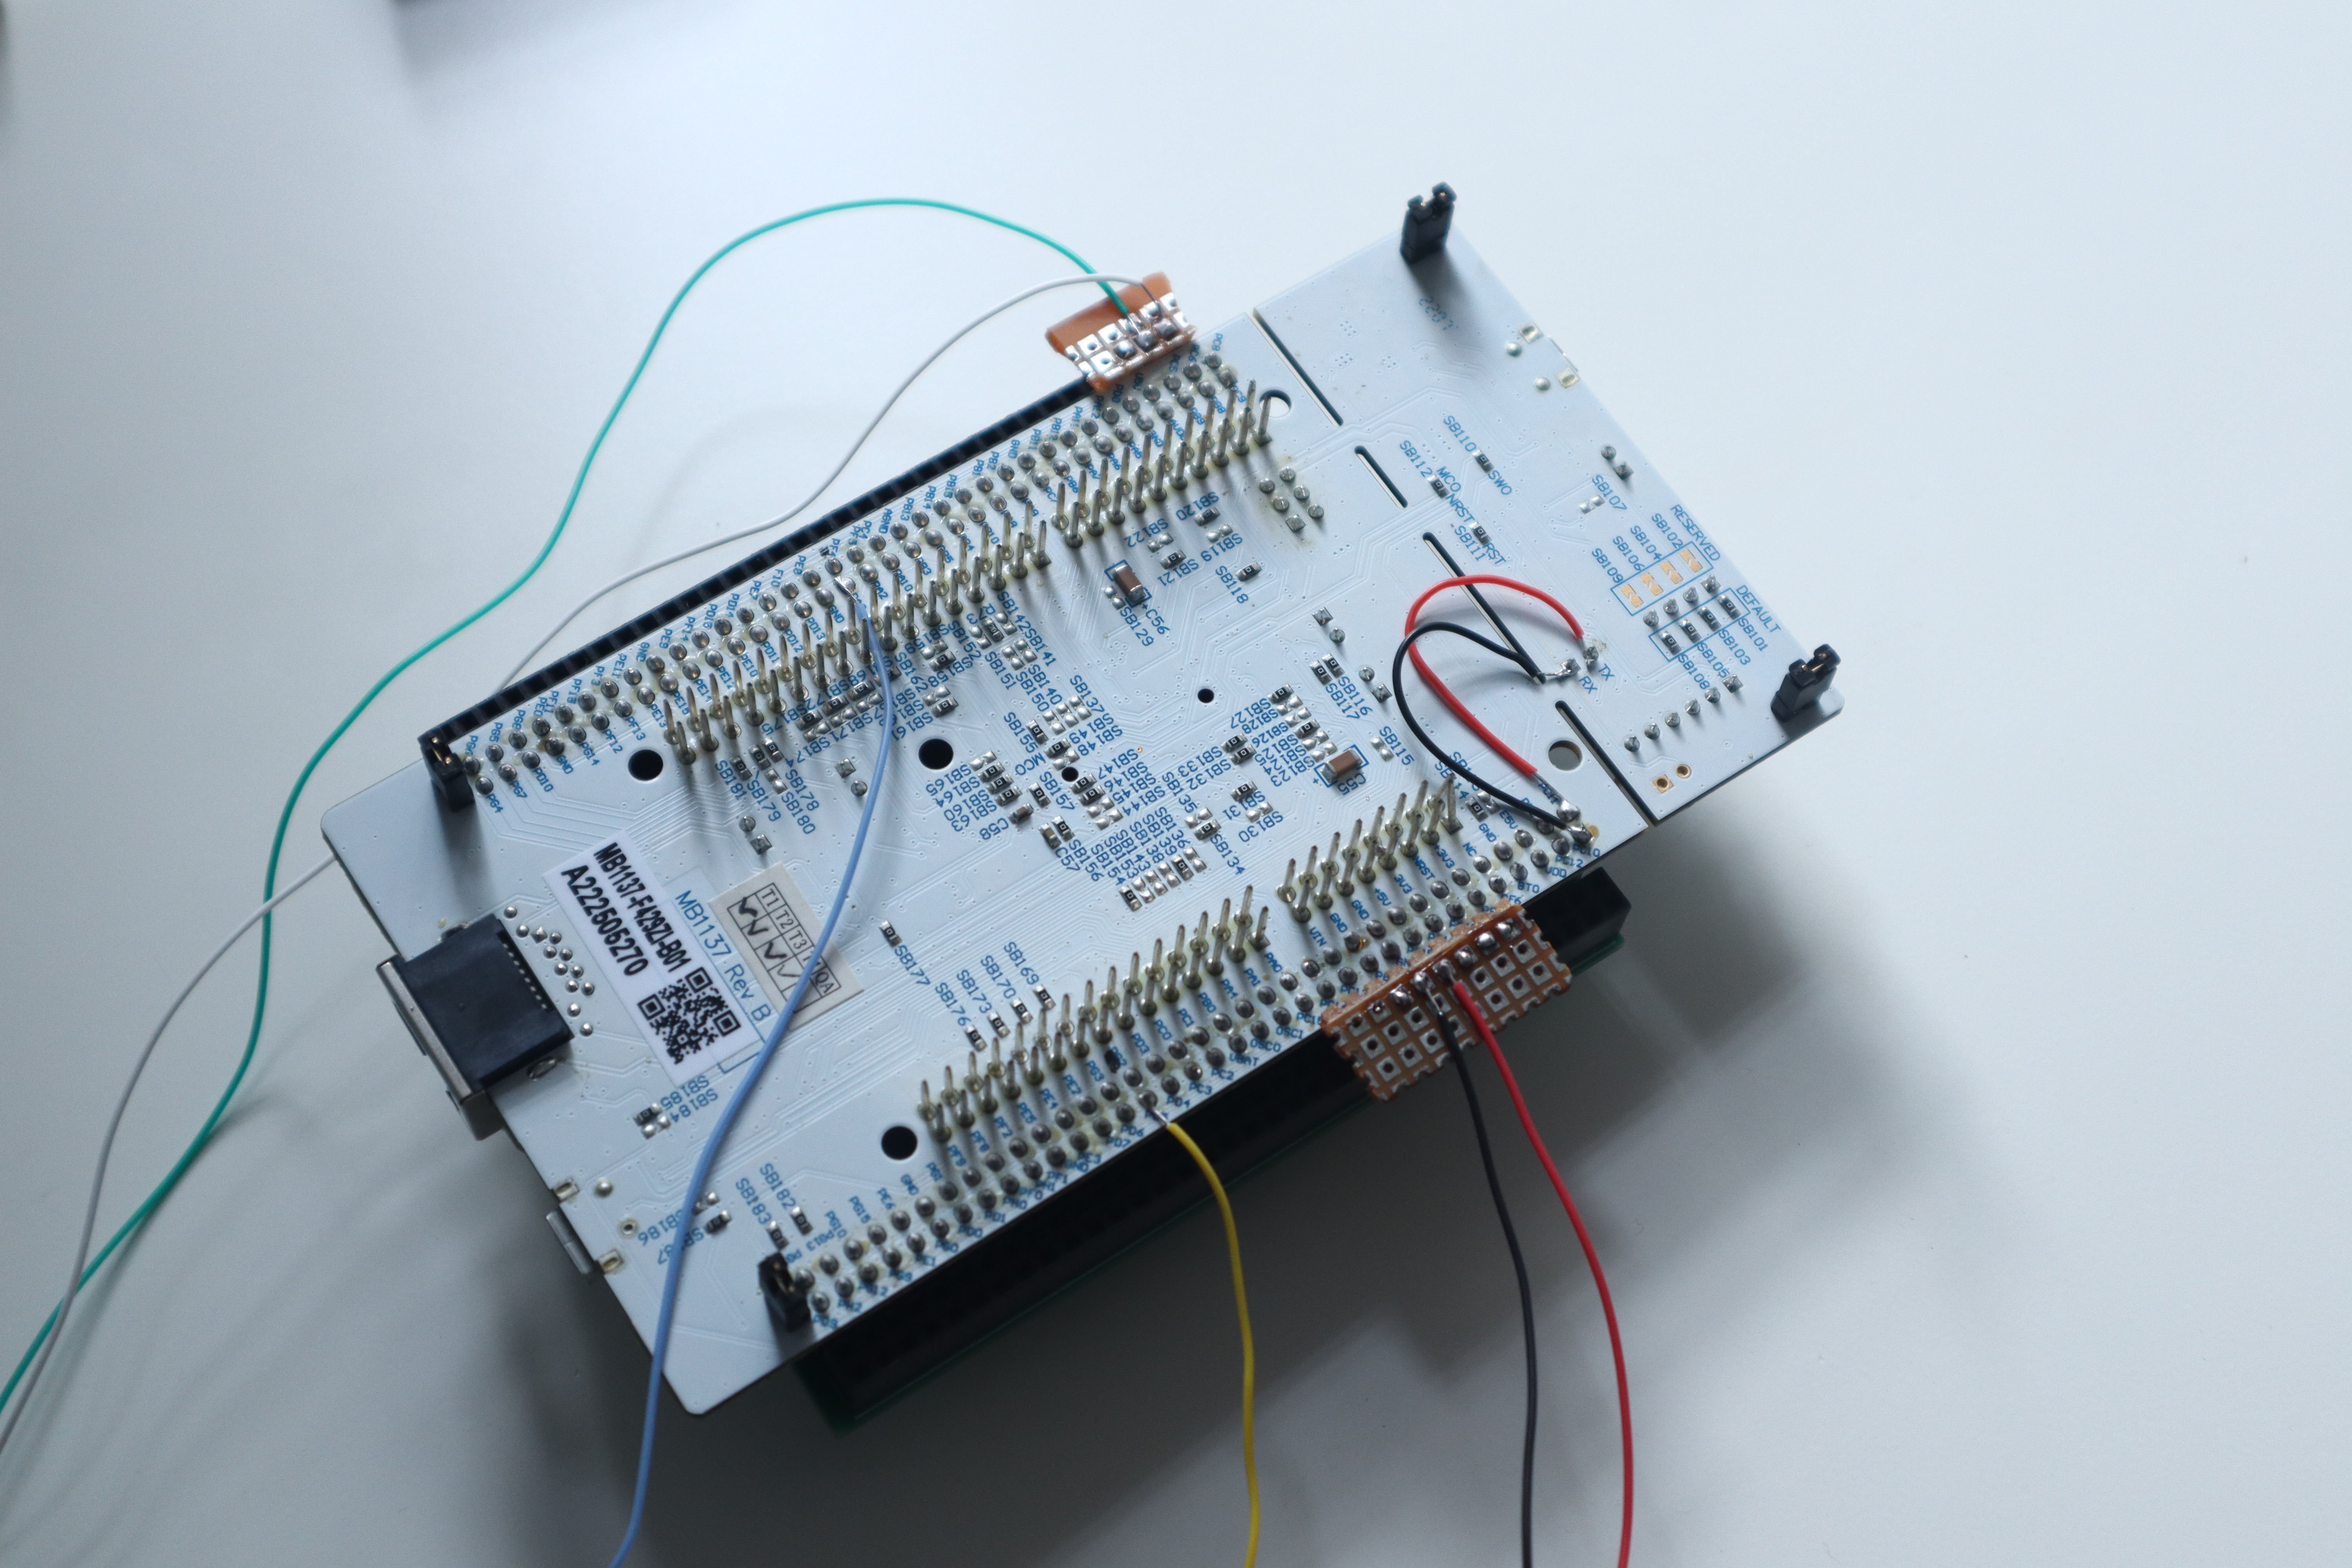
So we finished the finger clip, It's time to move on to STM32 Nucleo. For some of the soldering connections in the Nucleo I have used small headers attached with male headers and the remaining are directly soldered.
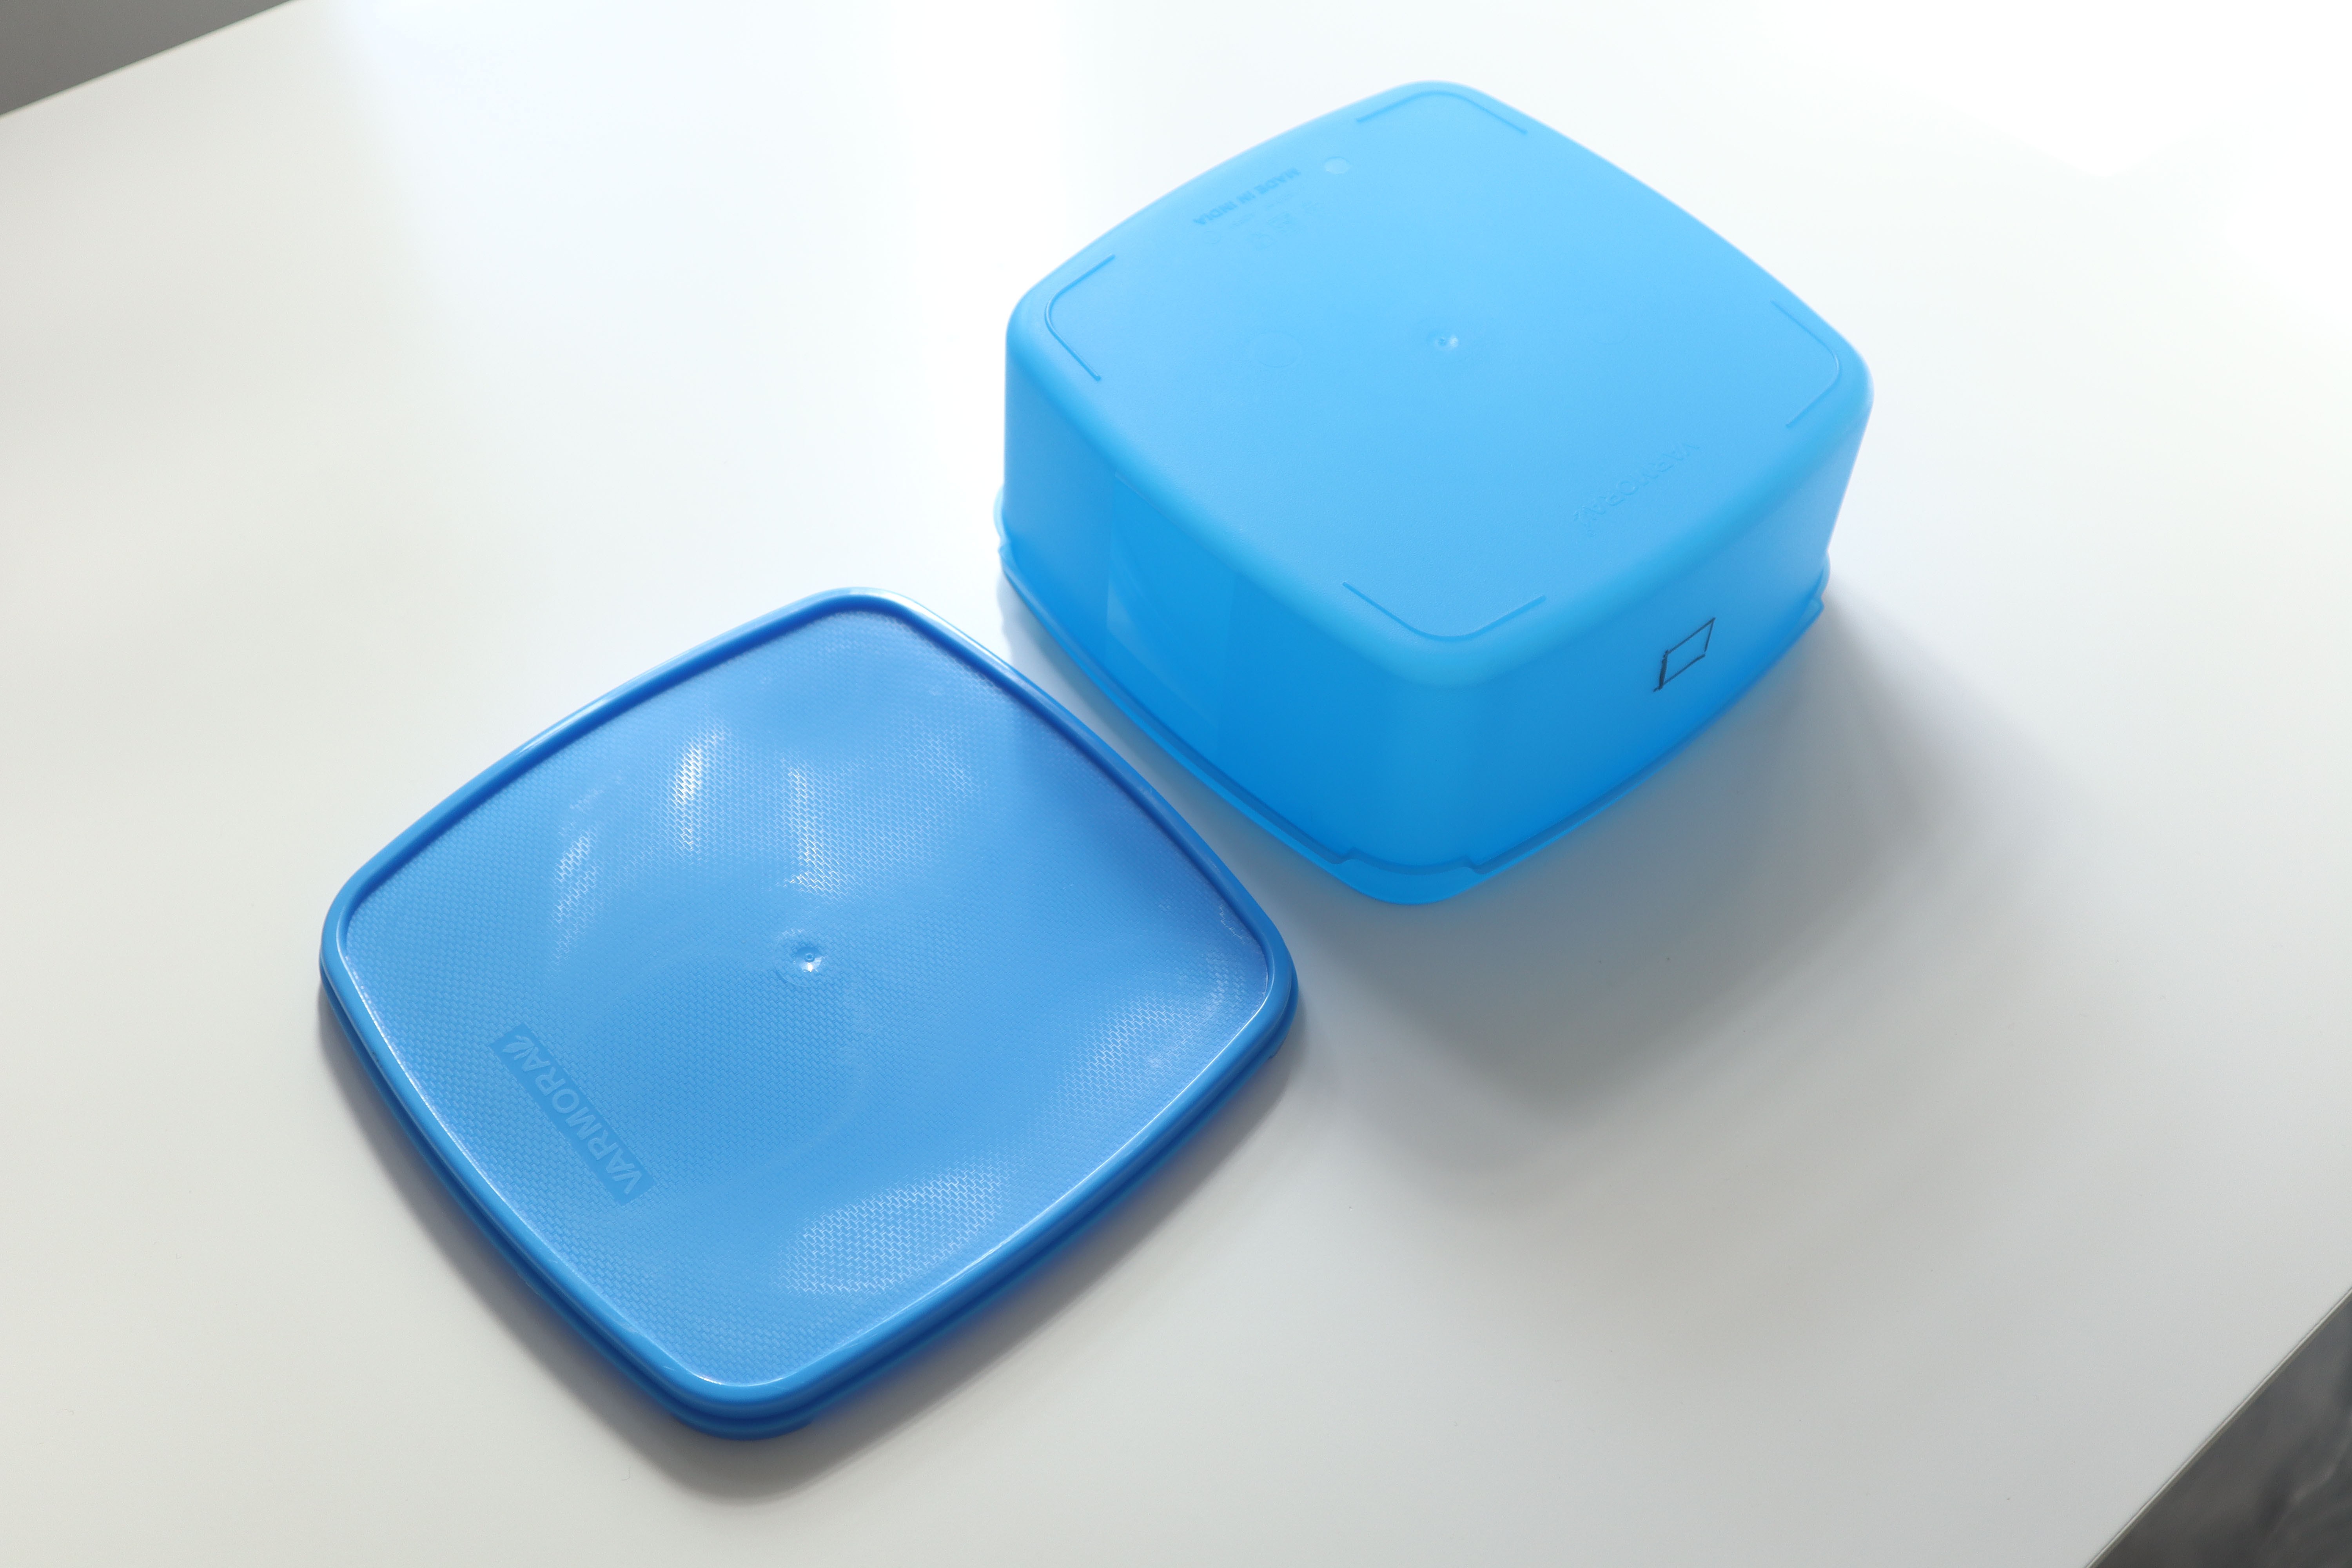
To secure all these things we need a large box, 3D printing would be not that cost-effective, So I decided to buy a clean box from the local store.
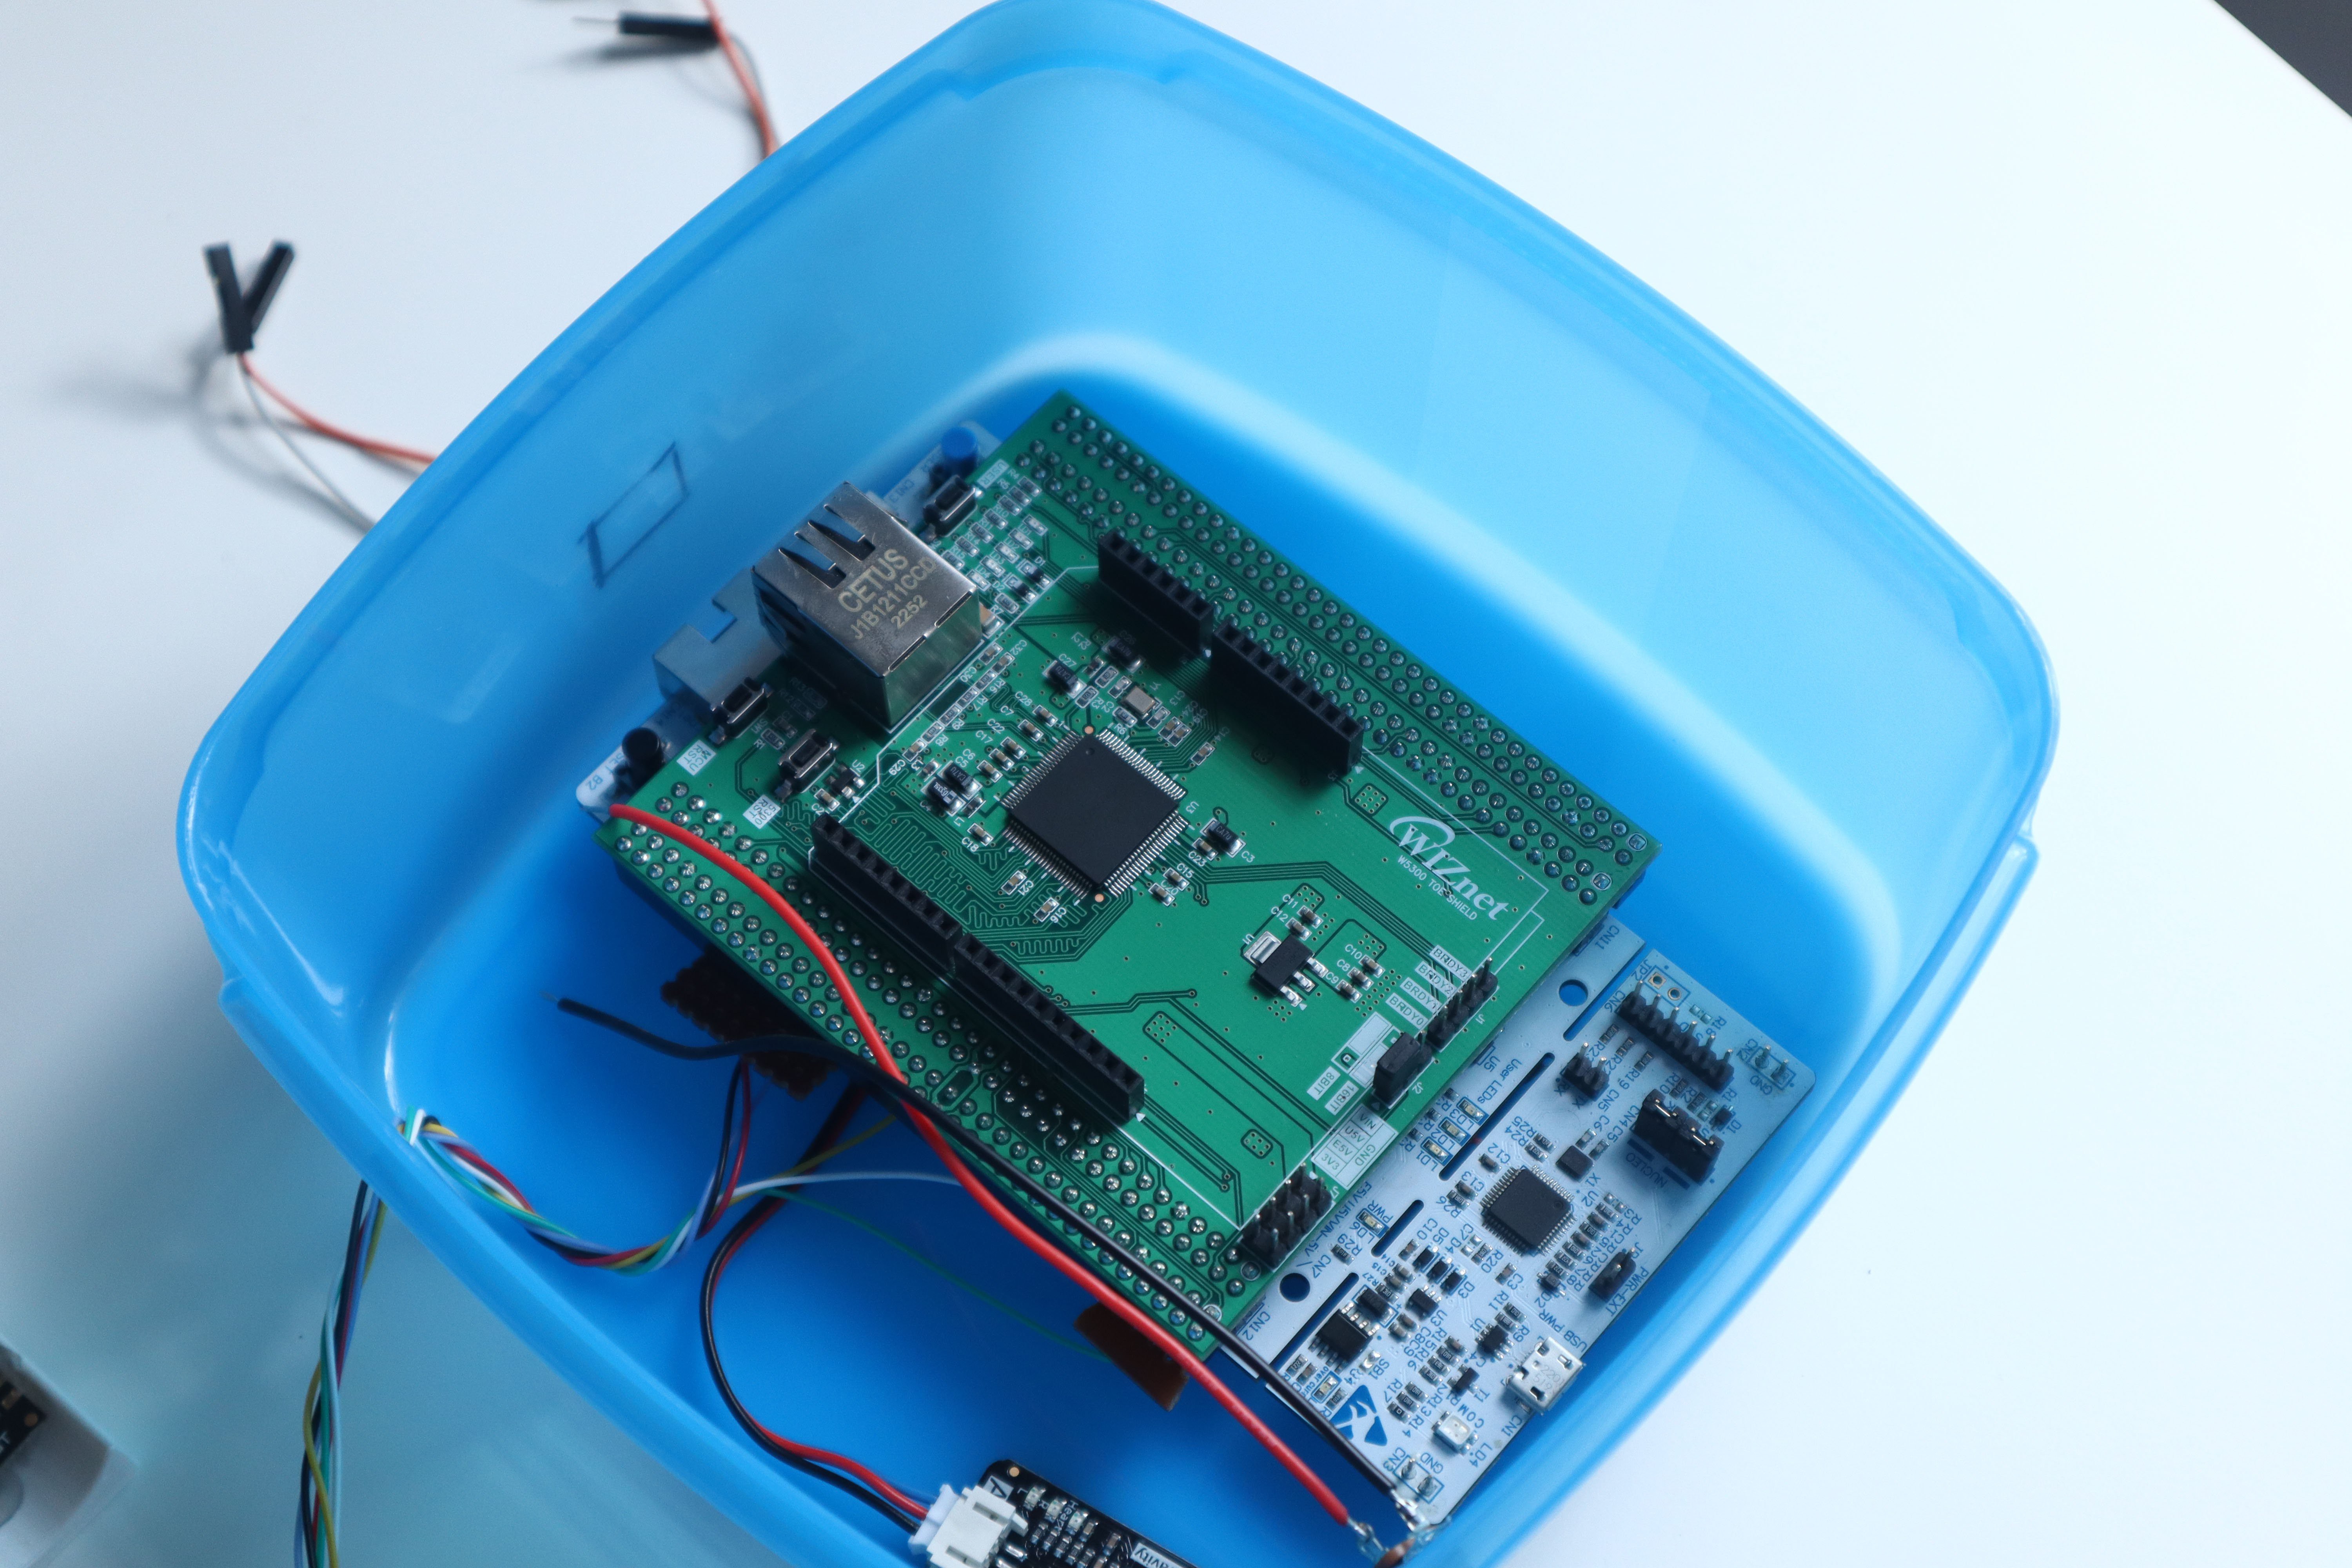
Then begin to secure all components to this box. To make the holes for this box I have used my old soldering iron.
For powering the system I have used a 12V 1 A DC power supply which will be given to the Vin of Nucleo through this DC jack.
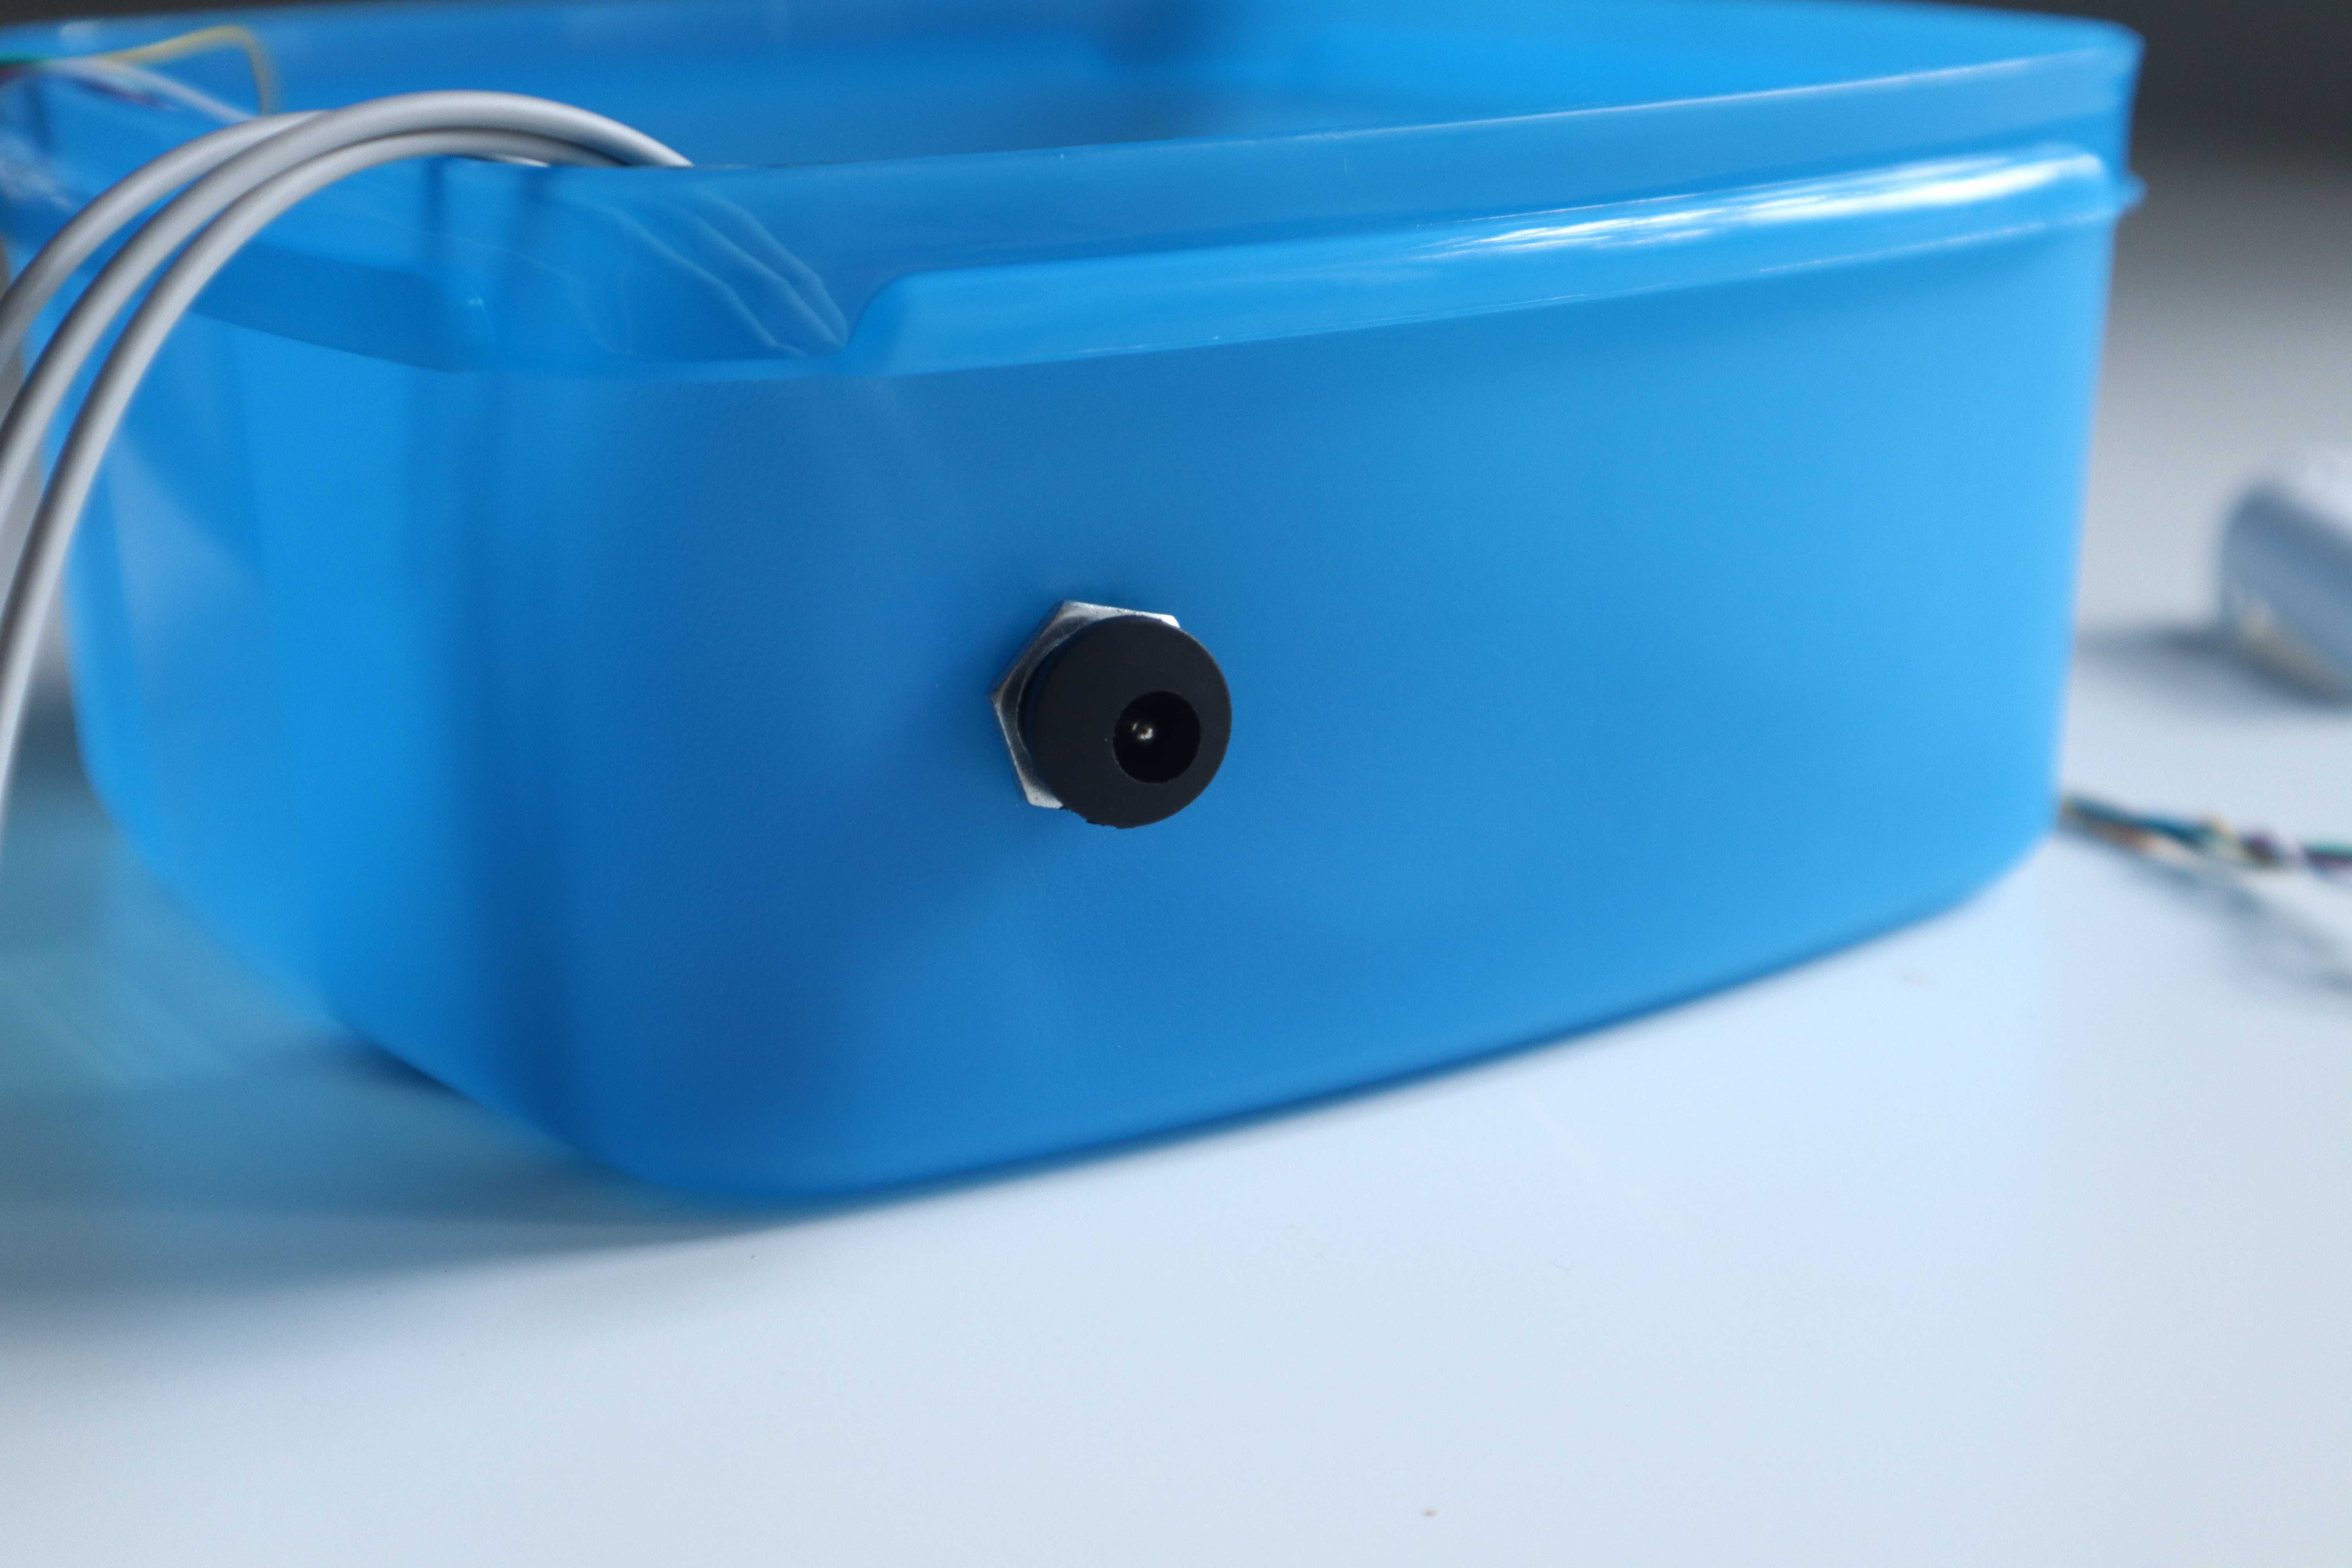
My device will be ready now by just closing the lid.
Building Dashboard With Kaa IoT
Kaa IoT, a versatile platform for developing and managing IoT solutions, supports a variety of communication protocols to ensure seamless data exchange between devices and the platform. One of the key protocols it accommodates is MQTT (Message Queuing Telemetry Transport), which offers lightweight and efficient communication, making it suitable for real-time monitoring and control applications.
The Kaa IoT platform offers a comprehensive and user-friendly dashboard that serves as a central hub for managing and monitoring IoT devices and applications. The dashboard provides a visual interface through which users can efficiently oversee their connected devices, gather insights, and control various aspects of their IoT ecosystem.
Key features of the Kaa IoT dashboard include:
1. Device Management: The dashboard allows users to view and organize all their connected devices in one place. This includes device status, connectivity information, and data transmission details. Users can easily add, remove, and categorize devices, simplifying the management process.
2. Data Visualization: Kaa's dashboard provides tools to visualize the data generated by IoT devices in real-time. This could include graphs, charts, and other visual representations that help users understand trends, patterns, and anomalies in their data streams.
3. Analytics: With built-in data analytics capabilities, the dashboard enables users to perform various analyses on the collected data. Users can gain insights into device performance, usage patterns, and operational efficiency, helping them make informed decisions.
3. Alerts and Notifications: The dashboard can be configured to send alerts and notifications based on predefined conditions or thresholds. This feature ensures timely responses to critical events or deviations from expected behaviours.
4. Device Control: Users can remotely control IoT devices through the dashboard. This might involve sending commands, adjusting settings, or triggering specific actions on connected devices.
5. Security and Access Control: The dashboard supports user authentication and access control mechanisms, ensuring that only authorized individuals can access and manage the IoT infrastructure. This helps maintain data security and privacy
6. Customization: Depending on the specific use case, the dashboard can often be customized to display the most relevant information and features for users, enhancing usability and efficiency.
Connecting a device to the Kaa IoT platform and creating a dashboard involves several steps.
Here's a simplified guide:
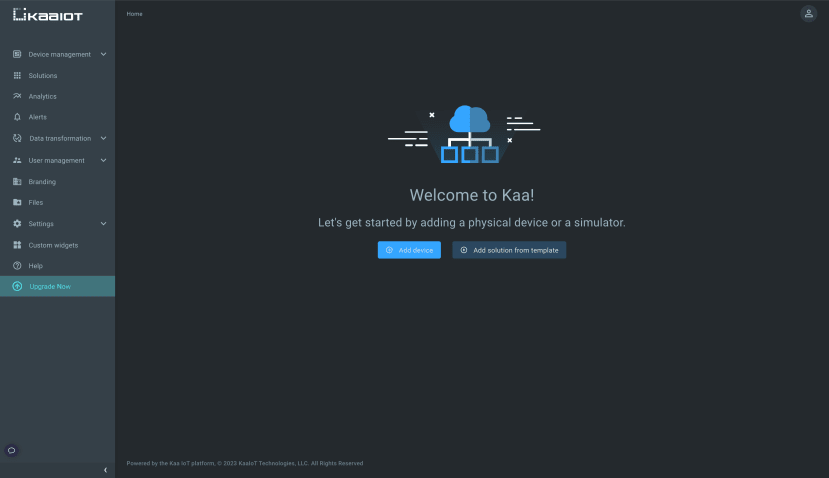
- Go to the Device Management tab in your Kaa Cloud account assuming that you have signed up for one.
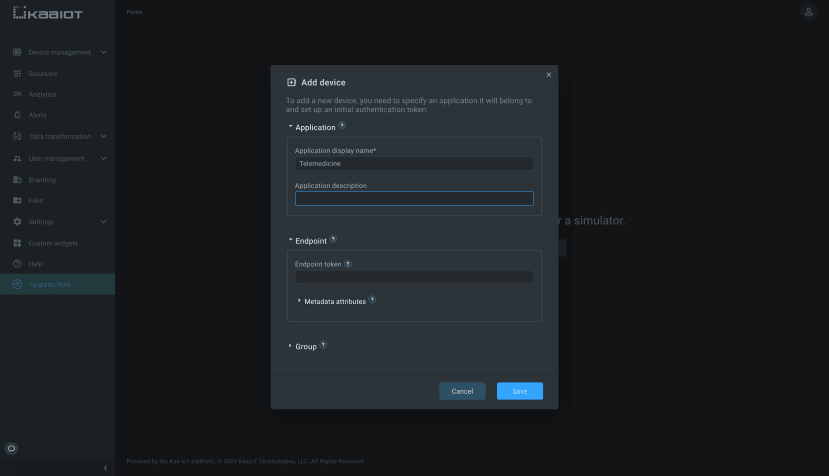
- Select the Add device option to start the registration process for a device's digital twin, referred to as an "endpoint" within the Kaa platform.
- In the form provide a display name and application description for your application, along with an endpoint token. You have the option to leave the endpoint field blank, in which case Kaa IoT will generate a random token for the device.
- If the token is generated by Kaa IoT, remember to securely store it, as it's essential for establishing a connection with the platform.
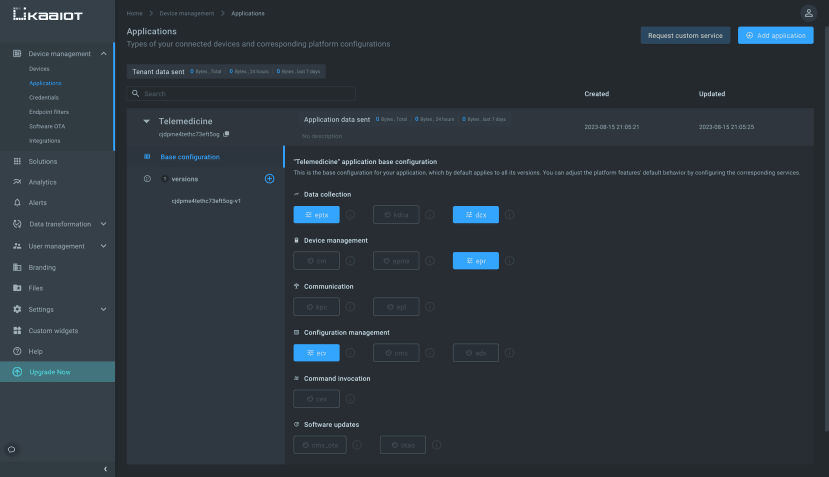
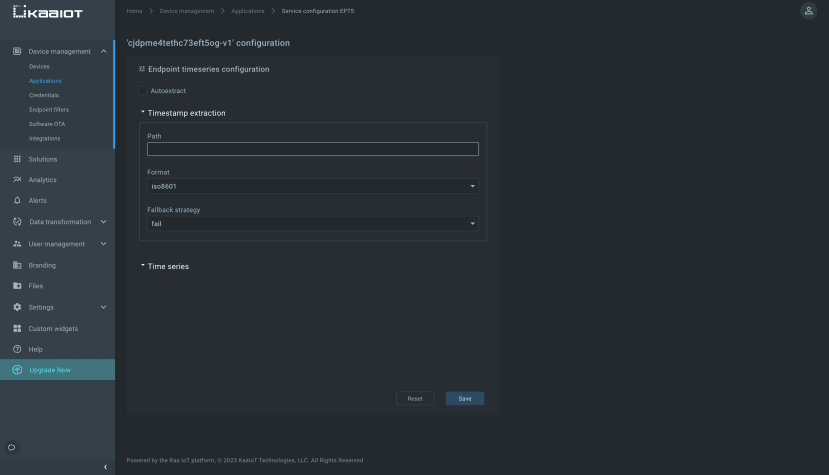
- Now navigate to Device Management - Applications - Your Application - Versions - Your Application ID - v1
- Select epts and set "Autoextract" enabled and save the configuration to proceed.
- Load a sample code onto your device that transmits telemetry data to the "epts" endpoint. Next, navigate to Device Management - Devices - Your Endpoint. If you observe a display resembling this, your configuration is successful, confirming your device's successful connection to the cloud.


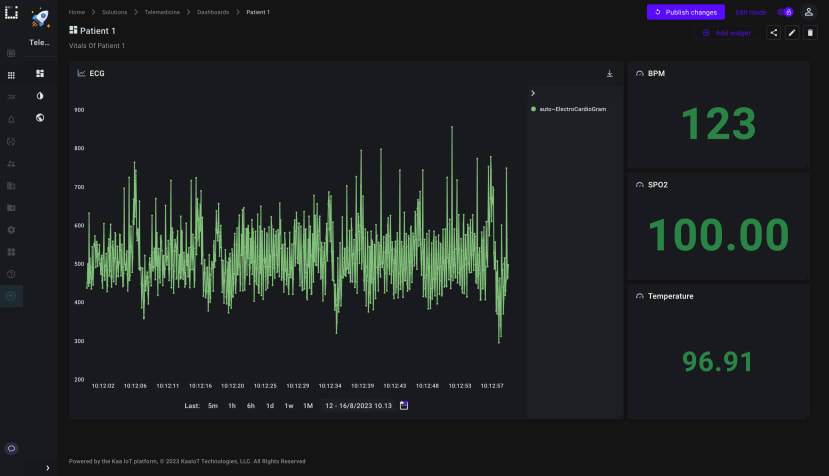
- To create a dashboard move on to Solutions - Your Project - Dashboards. Customize the default 'Home' dashboard by incorporating relevant information. Add relevant widgets and configure them accordingly. This is my dashboard containing all the widgets needed for this project.
IFTTT For Alerts
IFTTT, which stands for "If This Then That," is a web-based service that allows users to create automated workflows and connections between various apps, devices, and services. It enables users to set up conditional statements, called applets, that trigger an action (the "then that" part) when a specific event or condition occurs (the "if this" part).
IFTTT offers a wide range of integrations with popular apps, smart home devices, online services, and platforms. It simplifies the process of automating tasks and interactions between different digital tools, making it possible for users to create custom interactions without the need for complex programming.
Follow this quick guide to set up an IFTTT applet to send alerts.
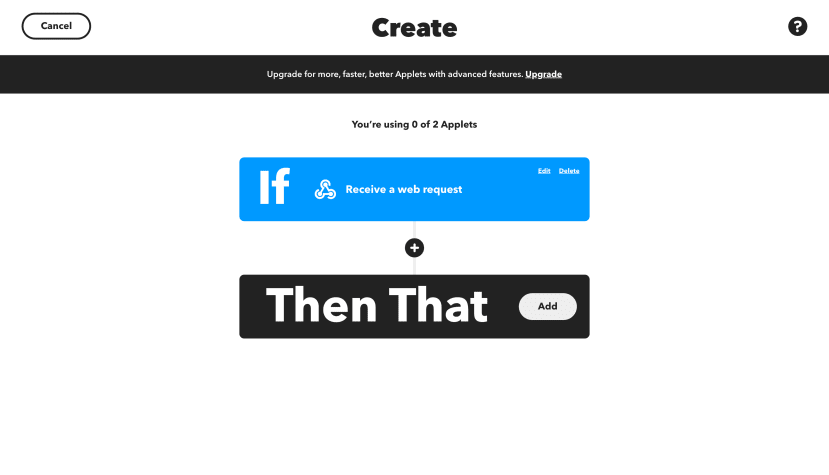
- Login and Access Webhooks and Services: Log in to your IFTTT account and navigate to your profile. Then, click on "Create" to start setting up a new Applet.

- Choose a Trigger Service: Click "+ If This" to choose a trigger service. Search and select "Webhooks" as the trigger service.
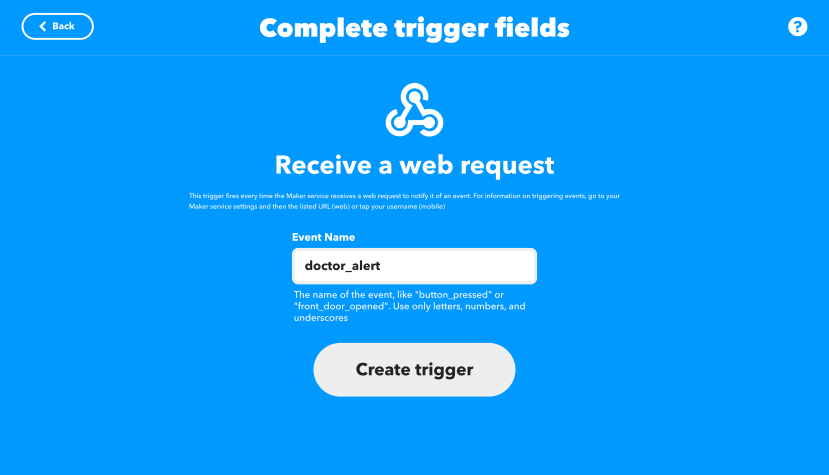
- Select a Trigger Event: Choose a specific trigger event for the Webhooks service. For example, you might select "Receive a web request."

- Configure the Trigger: Provide a unique event name (also known as a trigger name). This will be used to identify the trigger when calling the webhooks. Once configured, click on "Create trigger"
- Choose an Action Service: After setting up the trigger, click on "+ Then That" to choose the action service that you want to connect with your webhook trigger.
- Select an Action Event: Choose the specific action event you want to trigger based on the webhook. In this case, select "Email".

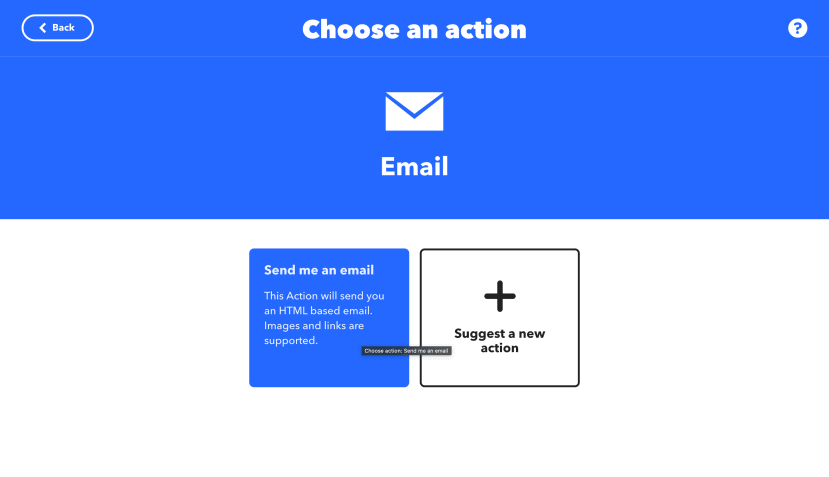
- Configure the Action: Set up the action's parameters as required by the selected service. This could involve specifying settings, data, or other relevant details.
- Complete the Applet Setup: Once you've configured the action, finalize the Applet setup by clicking on "Finish".


Conclusion
The internet-connected patient monitor transcends mere technological innovation; it exemplifies the confluence of advancement and compassionate healthcare delivery. This pioneering solution dismantles geographical barriers, reshaping critical care dynamics. As technology propels forward, its influence on healthcare remains profound, culminating in an era where distance is no longer a barrier to life-saving interventions. The internet-connected patient monitor beckons us into a new chapter of medical intervention—one that is inherently patient-centred, globally-connected, and powered by the seamless fusion of innovation and technology.
By developing an internet-connected patient monitor powered by advanced microcontroller and networking technology, the project is effectively bridging geographical gaps in healthcare access. This innovation enables real-time monitoring of vital signs and data transmission to a cloud-based dashboard accessible worldwide, ensuring that patients in underserved or remote areas can receive timely interventions and medical attention. Moreover, it empowers healthcare professionals with data-driven decision-making tools, facilitating collaborative care and optimizing resource allocation. Overall, the Vitalink project plays a vital role in improving healthcare equity and patient outcomes, making it a valuable contribution to the pursuit of a more equitable future in healthcare, both locally and globally.