What Is Your Old Spectrum Analyzer Hidding From You?
Follow article
 Dave from DesignSpark
How do you feel about this article? Help us to provide better content for you.
Dave from DesignSpark
Thank you! Your feedback has been received.
Dave from DesignSpark
There was a problem submitting your feedback, please try again later.
Dave from DesignSpark
What do you think of this article?
Hello Again!
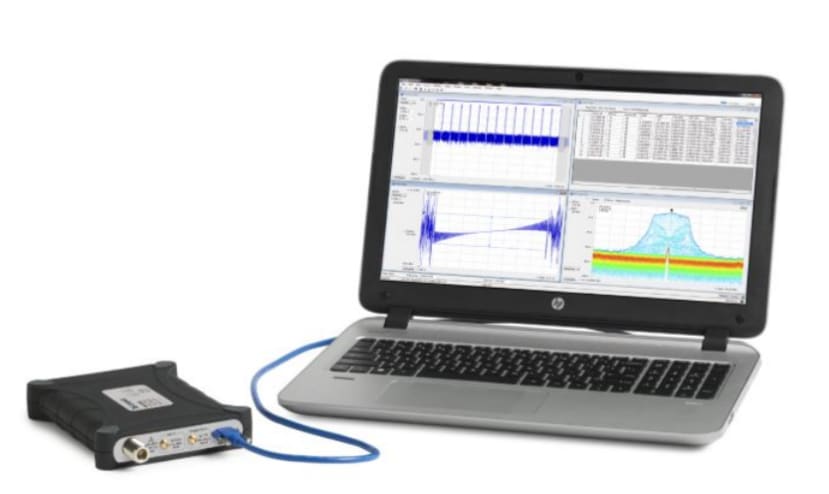
My names is Lee Morgan and I’m a business development manager for IoT and Power applications at Tektronix. I’m spending the month as a visiting blogger on DesignSpark, talking about all things wireless. Over the last few weeks I’ve written about the growing problems of interference in the development of IoT products and low cost EMI Pre-compliance measurements. I’ve talked about how Real Time Spectrum Analyzers (RSAs), such as the RSA306B, were accelerating the design cycle of such products in these tricky application spaces. Traditional RF engineers now have to grasp the time-varying nature of modern digital RF signals, and they are switching in their droves from Swept Spectrum Analyzers (SSA) to RSAs in order to give them the insight they need to get the job done. This week I’d like to spend a short time taking a closer look at an RSA and what makes it so different from the traditional tools I’ll also take some time to point out some of the unique features of the Tektronix RSA306B
Fig 1 – RSA306B
Different Types of Spectrum Analyzers
During my previous blogs I’ve been pressing home how RF signals are changing in their nature. While in the past they were typically static in the frequency domain, today’s signals are bursting and hop between frequency channels. With ubiquitous wireless connectivity, modern RF communications must also deal with many interferers in the spectrum.
A traditional Swept Analyzer works by making power versus frequency measurements by sweeping through the passband of its resolution bandwidth (RBW) filter. This filter allows the detector circuit to calculate the power at each frequency point in the span. While this method provides high dynamic range, its disadvantage is that it can only calculate the amplitude data for one frequency point at any moment in time. Therefore measurements are only really valid if the signal of interests is relatively static. If the signal changes rapidly, such as during PLL tuning stage, there is a high probability of the analyzer missing critical information.
Fig 2 – Block Diagram of Swept Analyzer, Vector Signal Analyzer and Real Time Spectrum Analyzer
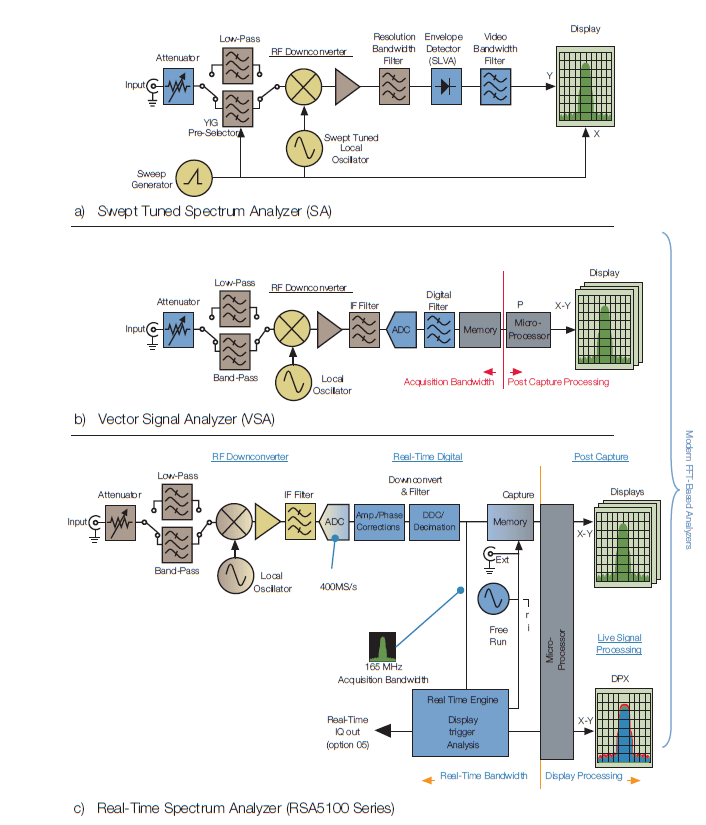
Spectrum analyzers then evolved to capture both amplitude and phase information. Vector Signal Analyzers (VSAs) use the same heterodyne architecture in the Swept Analyzers to downconvert the RF signal to a lower frequency band, but then digitize the signal, placing the digitized waveform in memory for post processing. DSP based Fourier math is used to plot the spectrum. As the frequency, phase and amplitude information is all contained in the sample waveform other parameters can be calculated such as constellation diagrams or error vector magnitude (EVM) or power verse time. VSAs have added the ability to analyze modulation, but still lack the capability to capture and display transient events. This is because of their serial nature, where the sampled data must be stored in memory before being batched processed. During the processing stage, the analyzer is blind to signal activities.
With RSAs the term “real time” is derived from the idea that if an operation can be completed fast enough to match the speed of the incoming signal, then the system has enough processing capability to process all the signal components without the loss of information due to dead times. This means that the ADCs and DSP cores must be fast enough to meet the Nyquist criteria and match the changing input signal. RSAs deploys a technique of applying the hardware-based DSP prior to the sampled waveform being stored in memory. The data in memory can then be extensively analyzed in multiple domains. These real time DSP engines include signal conditioning, calibration and even some of the analysis itself. Fig 2 shows the basic block diagram of each analyzer type, as you can see the RSA includes an extra processing engine which applies the DSP before it goes into memory.
How A Real Time Spectrum Analyzer Works
To illustrate how its real time works, Fig 3 shows how the DSP engines create the spectral view in less time than it takes to capture the samples, meaning the RSA is sitting ready for the next batch of samples to be processed.
Fig 3 – VSA Processing v RSA Real-Time Processing Engine.

This storage of seamless data from an RSA opens a whole new realm of measurement and visualization tools to engineers. With the Tektronix RSAs it is possible to plot that sampled data as Power v Time, Frequency v Time or Phase v Time. It is also possible to plot what we call a Spectrogram or is sometimes referred to as a “waterfall view”. Here frequency is plotted on the x-axis, time is plotted on the y-axis while the power information is displayed using a colour grading. FFT slices are effectively “stacked” one on top of another so a user can see how a signal is changing over time.
Fig 4 – Spectrogram

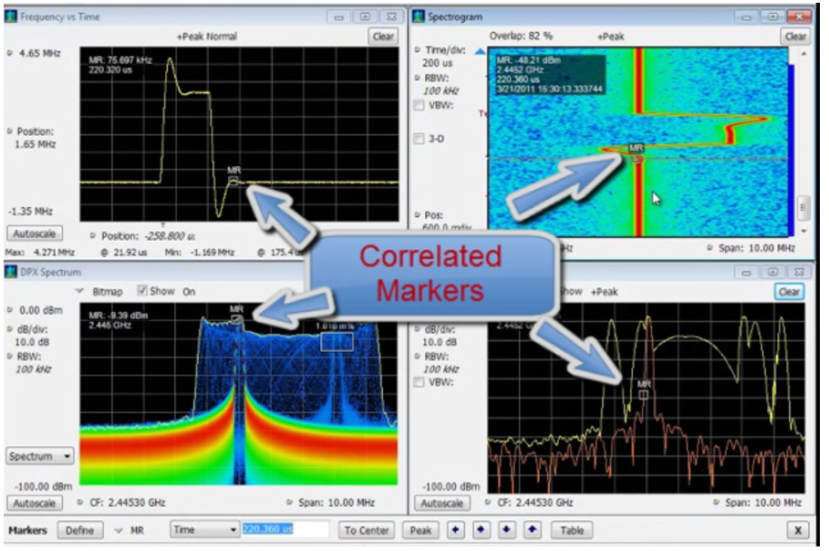
Now, because all of the waveform and spectral views are derived from the same data set it is possible to correlate between windows in the RSA306B user interface. This is a critical tool when discovering the time varying nature of modern RF signals. Below in Fig 5 is an example of a PLL losing and then regaining its lock. In bottom two plots we see the spectral view of the signal. In the top left we see the signal’s frequency v time plot, while on the top left we see the spectrogram. There is also a marker (MR) on the display which correlates between each window. As I drag the marker through or around any of these displays it will move the equivalent marker in the other displays. In the case of the spectral view it will update the slide of sampled waveform that is used to generate an FFT at that moment in time. In the PLL example a user can quickly answer the questions of – how often do I loose lock? How far does the signal drift away? How long is it unlocked for? And what sort of spectral and power penalties are there?
Fig 5 – Multi-Domain Correlation
See The Unseen with DPX
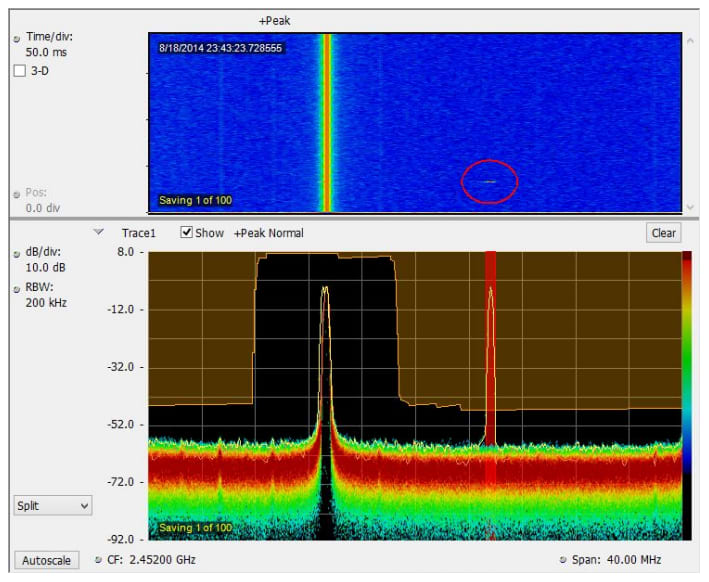
Another critical tool in the RSA306B arsenal is Digital Phosphorus Technology, or DPX. This is a patented acquisition mode that performs the hardware DSP processing and rasterizing of the samples into pixel information in order to reveal signal detail like never before. It gives a truly “live” view of the RF signals, with its colour-grading feature allowing users to see different signals at the same frequency, but separated by either time or power levels. You can literally see signals hidden beneath other signals! Just imagine how powerful that feature is if you’re an engineer working spectral monitoring or regulations, electronic warfare, IoT interference hunting or EMI pre-compliance to name just a few applications. The videos below shows the comparison between a conventional spectrum plot and a DPX plot. In this example we can see a small interference signal hidden underneath a pulsed RF signal with DPX, while it is impossible to see this interferer using the conventional swept analyzer or VSA. The RSA306B DPX mode can produce up to 10,000 spectrums per second!
Fig 6a – Conventional Spectral Plot
Fig 6b – DPX Display
Advanced Triggering on Spectrum Analyzers
One final aspect of the RSA306B is its triggering capabilities. The RSA utilizes the frequency, power, phase and timing information contained in the samples to not only create powerful displays and measurement tools, but unique triggering features. With Frequency Mask Triggering (FMT), a user can draw a trigger zone on the spectral display. When the signals breaks the zone, the RSA will capture and save a defined amount of samples, just like in an oscilloscope. In Fig 7 we can see how the FMT feature is used to trigger on a signal inside the brown zone. FMT allows users to trigger and capture precise duration of the RF spectrum, and can vary the trigger point to store either pre and/or post trigger information.
Fig 7 – Frequency Mask Triggering
I’ve really just scratched the surface here on some of the RSA306B’s capabilities. The RSA also contains general purpose demodulation techniques commercial wireless compliance modules for standards such as WLAN and Bluetooth for improved time to market, GSP, Signal Mapping and Signal Classification tools for spectral monitoring in the field, and free offline analysis capabilities.
For more information on how real time spectrum analyzers work I strongly recommend, the following reading material, 37W-17249-5 and 37W-19638-6. I’d really like to hear your thoughts and questions in the Comments section below.
If you fancy something different, why not check out another track I am writing about how the plain, old, vanilla-flavoured, bench scope has evolved in the Educational labs, and now today new powers and teaching tools to today’s professors. Hope you can check it out!
Lee Morgan
About Author:
Lee Morgan is an Account Manager with Tektronix UK Ltd, with over 16 years’ worth of experience in the Test & Measurement sector, covering a multitude of roles in the Mobile Telecommunication, Electrical & Power industry, he has an excellent insight into how modern Test & Measurement Equipment can aid the engineers of today in creating the products of tomorrow.