Thermal comparison of three embedded Linux boards
Follow article
 Dave from DesignSpark
How do you feel about this article? Help us to provide better content for you.
Dave from DesignSpark
Thank you! Your feedback has been received.
Dave from DesignSpark
There was a problem submitting your feedback, please try again later.
Dave from DesignSpark
What do you think of this article?

Thermal imaging a Raspberry Pi 1 and 2, and BeagleBone Black, idle and under load.
Before sending back a Flir E5 camera that we have on loan, I thought I'd compare the peak temperature of a Raspberry Pi 1 Model B, Pi 2 Model B and BeagleBone Black, when each of these are idle and again when they are under load. I should point out that this is not a particularly scientific test, but rather a matter of curiosity and seeing how each fares in terms of generating heat.
Cold
To start with an image was taken with each board cold.

First up was the single core Raspberry Pi 1 Model B.

Followed by the quad-core Pi 2 Model B.

And finally, the BeagleBone Black.
As one would hope, only minor variation can be seen in the peak temperatures — displayed top-right of each image — and the spot temperature located roughly in the centre of each board. And even then these may be down to the varying emissivity/reflectivity of each board.
Idle
The boards were then imaged again after 30 minutes of being powered-up and with no load.
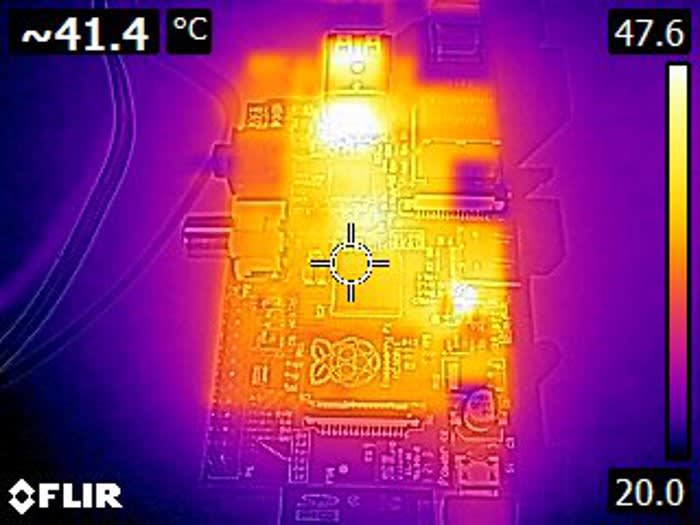
Here we can see that part of the Raspberry Pi 1 Model B has risen to 47.6C.

Whereas the Pi 2 after the same period of time has only peaked at 41C. This is most likely a side effect of the power supply being upgraded from using a linear to a switching voltage regulator, with the former being much more wasteful and effectively throwing away energy as heat.

The BeagleBone Black came in a little hotter after 30 minutes, peaking at 43.5C. Although different SoCs and boards integrate different peripherals, and this will contribute to the total power dissipation, along with the number of ARM cores and their clock speed etc.
Under stress
Next the boards were put under load using the stress-ng tool, with:
$ stress-ng -a 1This can be run with many different options and if you really want to put a system to test, these should be tuned for that particular system and perhaps also the subsystem that you are most interested in. However, since we just wanted to generate a decent load and that was the same on each board, specifying “-a 1” should suffice as it runs one worker (instance) of every test.
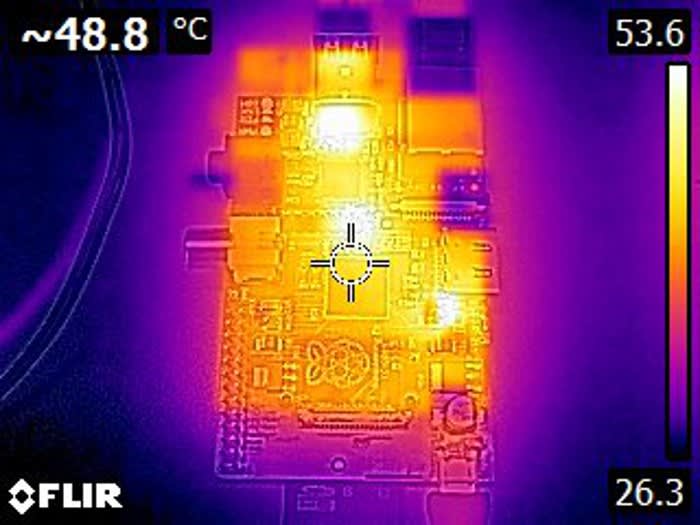
After 30 minutes under stress we can see that the Raspberry Pi Model B reached 53.6C.

Whereas the Pi 2 got that little bit hotter at 56.7C after 30 minutes under load.
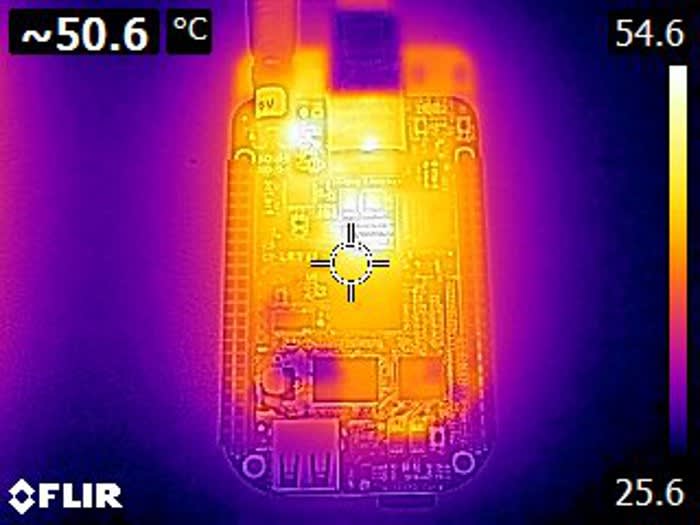
And the BeagleBone Black peaked at 54.6C.
Interpreting the results
First, some caveats:
-
Peak temperatures were observed and not total heat generated
-
A workbench is hardly an environmental test chamber!
Obligatory disclaimers aside, the results are pretty much as you would hope, with the Pi 2 running cooler than the Pi 1 when idle, more than likely thanks to an improved power supply. Under stress the single-core Pi and BBB peaked at around the same temperature, whereas the Pi 2 got hotter, but it was almost certainly getting more done when all those various stress tests were spun up.
Final thoughts
If we wanted to accurately measure the comparative thermal dissipation, and perhaps make more sense of this by also measuring the compute performance and efficiency, we'd need to be a lot more methodical and to have a much more controlled test environment. However, these simple tests have provided an insight into the comparative temperatures you might expect to see with each board when they're put under stress.
Get your hands on a Flir E5 Thermal Imaging Camera
Thermal imaging can be very useful for identifying changes in temperature. We decided to put this to the test and undertook a study to understand what happens to our bodies when we consume chillies. Staggeringly, the body temperature of our guinea pig increased by 4 degrees!