The remote health monitoring system (hardware development and measurement)
Follow article Dave from DesignSpark
How do you feel about this article? Help us to provide better content for you.
Dave from DesignSpark
Thank you! Your feedback has been received.
Dave from DesignSpark
There was a problem submitting your feedback, please try again later.
Dave from DesignSpark
What do you think of this article?
Introduction
Heart disease is a commonly-known disease in the world. Patients suffering a heart attack may lead to stroke or even death. One early symptom of heart attack is arrhythmia. If arrhythmia occurs frequently, patients will have a higher chance of having a heart attack.
When our heart beats, there is a small change in electrical potential across the heart which can be transformed into voltage waveform. This waveform is commonly named as Electrocardiography (ECG). The ECG waveform contains three parts, i.e. P, QRS and T wave. The shape of the waveform would look similar to Figure 1 for a healthy person.
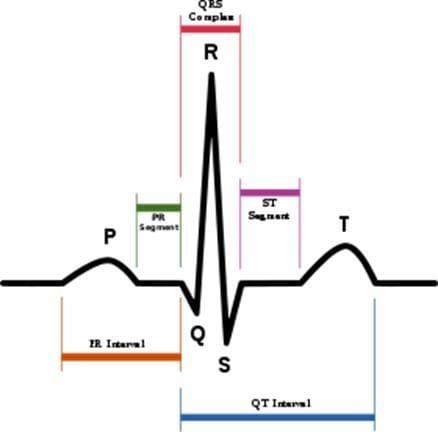
Figure 1. Normal ECG waveform
Irregular heartbeat means the heart is having abnormal movements and this generates abnormal ECG waveforms.
There are different types of arrhythmia such as premature ventricular contractions and ventricular ectopic beats. Each type of arrhythmia has a unique shape such that doctors can determine patents’ type of heart disease according to the ECG waveform.
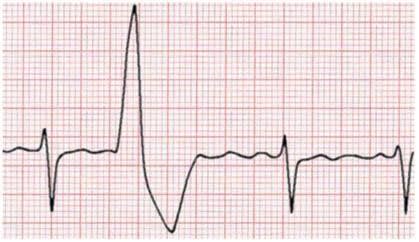
Figure 2. Premature ventricular contraction
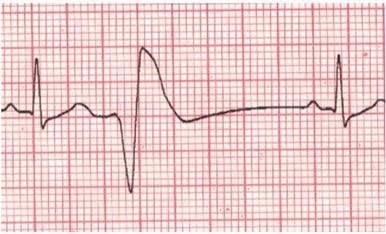
Figure 3. Ventricular ectopic beats
One major reason that heart diseases have a high risk of death is that arrhythmias are hard to discover. In s traditional ECG examination, electrodes are placed on the patient’s body and then connected to professional ECG monitoring machine. Patients cannot be monitored on a 24/7 basis as such ECG monitoring can only be performed in the clinic. Therefore, such a traditional approach cannot predict heart attack effectively.
The ultimate goal of this project is to provide a cost-effective portable ECG monitoring solution with automatic diagnostic function.
Design and Implementation
System overview
The new generation remote ECG monitor system is formed by three parts. They are:
- Wearable ECG measurement hardware signal filtering and signal improvement
BLE technology to replace 3G module for low-power consumption portable with battery charging function more local processing with deep learning classifier on MCU. - User mobile APP connects to a measurement device via BLE technology real-time information display and communicates with an online server and database.
- Online server with ML classifier as reference for MCU classifier.

Figure 4. System Overview
Analogue front end (AFE) design
The analogue front end is a part of the circuit which responses to capture, filter and amplifier analogue signal. Usually, AFE will apply on small-signal capturing such as in ECG application. Some advanced AFE will include Analogue-Digit Convert (ADC) and Digit Signal Processing (DSP) functions.
In this project, AD8232 is chosen to the ECG AFE. AD8232 is mainly formed by an instrumentation amplifier, an operation amplifier, a right leg drive amplifier. These three components are highly related to ECG signal amplifying. AD8232 also includes electrodes leadoff detection and automatic fast restore circuit.

Figure 5. AD8232 block diagram
As the human body signal strength is very weak. The signal needs to be filtered and amplified to convert back an ECG signal. AD8232 is flexible that engineers can custom design analogue filters to adjust the ECG signal bandwidth and control the signal gain. There are four steps in an ECG signal reproduction procedure. Firstly, the human body signal will pass through an instrumentation amplifier. The instrumentation amplifier will amplify the voltage differential between two electrodes (IN+ - IN-) around 100 times. Then, the signal will pass through a high-pass filter. The low frequency (below 0.5Hz) noise which is generated by muscle movement and respiration will be filtered out. Then, the signal will pass through a low-pass filter in order to filter out the high-frequency noise such as 60Hz interference. Finally, the filtered signal will be amplified again by an operation amplifier and output with an analog signal.

Figure 6. ECG signal reproduce procedure
One of the most popular ECG AFE solutions on the market is AD8232 module from Sparkfun. The module can capture ECG perfectly while the patient is at still during the measurement. However, the ECG signal is distorted due to body movement. Therefore, this module is not suitable for portable use.

Figure 7. AD8232 module from spark fun

Figure 8. ECG signal distorted
Therefore, I decided to redesign the analogue filter for portable use with the AD8232.
Analogue Filter Design
High-Pass Filter selection
AD8232 datasheet provides three types of high pass filter and that’s mean AD8232 maximum can form a three-pole high pass filter. Higher order filter is proportional to better performance of the filter. However, higher-order filters will result in the need to place more components on the PCB. To have a balance between the PCB space and the performance of a filter, a two-pole high pass filter is selected in this project.
The first high pass filter is formed by a RC network which is connected to the output of the instrumentation amplifier through HPSENSE and HPDRIVE. This RC network acts like an integrator that feeds DC signals back into the instrumentation amplifier to eliminate the low-frequency signal. The performance of this high pass filter is strong and stable. It provides a stable 20dB per decade decline rate to the low-frequency side. This part of the circuit is applied to the AFE.

Figure 9. 1st High pass filter
The second high-pass filter is adding a pole to the DC blocking circuit to form a high-pass filter. The advantage of using this high-pass filter is that it provides a narrow pass band with the maximum pass band fatness. However, the performance of this filter is reduced in the low-frequency region and there is no effect on signals below 0.1 Hz. The ECG module is using this design and we would like to explain why it is not good under bodily movements.

Figure 10. High-pass filter 2

Figure 11. 2nd filter become invalid under 0.1Hz
Another high-pass filter is considered and added in this ECG measurement circuit to improve the ability of anti-motion effect. An RC network is connected to the output of the instrumentation amplifier. Combined with two high-pass filters, this two-pole high-pass filter provides stable and powerful performance with + 40dB per decade.

Figure 12. Two pole high-pass filter
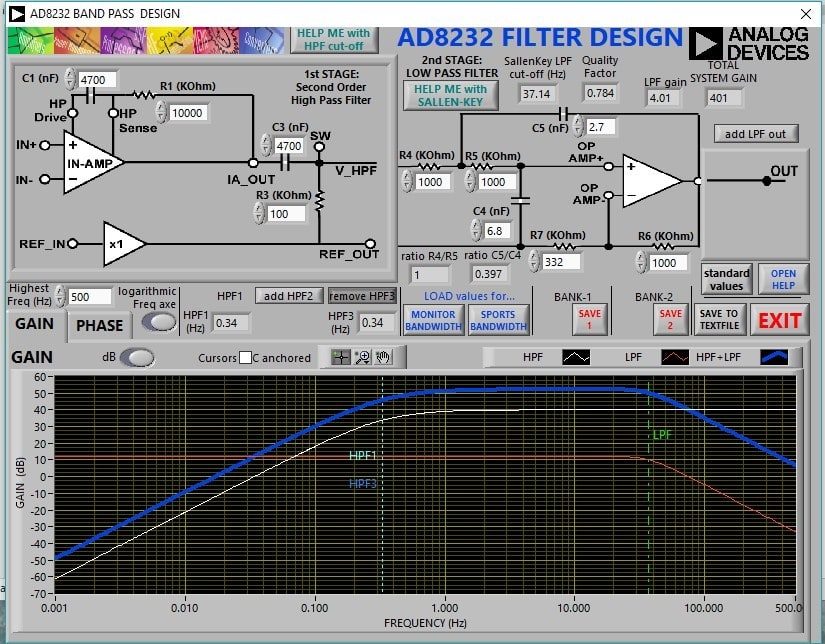
Figure 13. +40dB per decade
Low-Pass Filter selection and 2nd stage gain
The Sallen-Key [5] two-pole low-pass filter is chosen in this project. The filter provides a sharp cut off point and the following equations show the gain and Q value of this circuit:
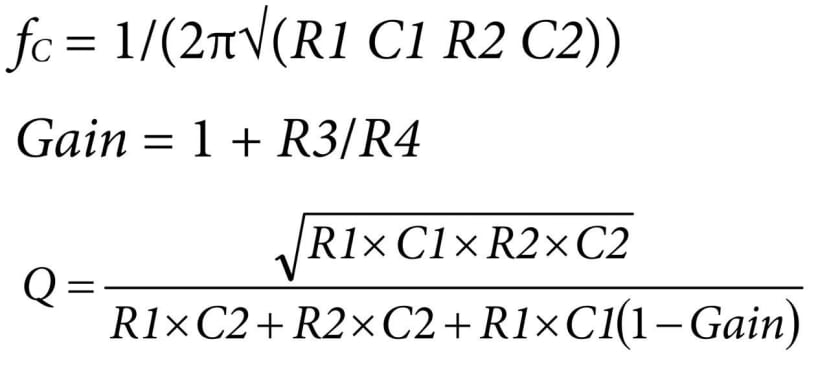

Figure 14. Sallen-Key low-pass filter
Right-Leg Drive circuit
The right-leg drive circuit can improve the common-mode rejection of the system. The right leg drive amplifier inverts the common-mode signal from the instrumentation amplifier input and output to the user's body in order to provide feedback to reduce common-mode noise.
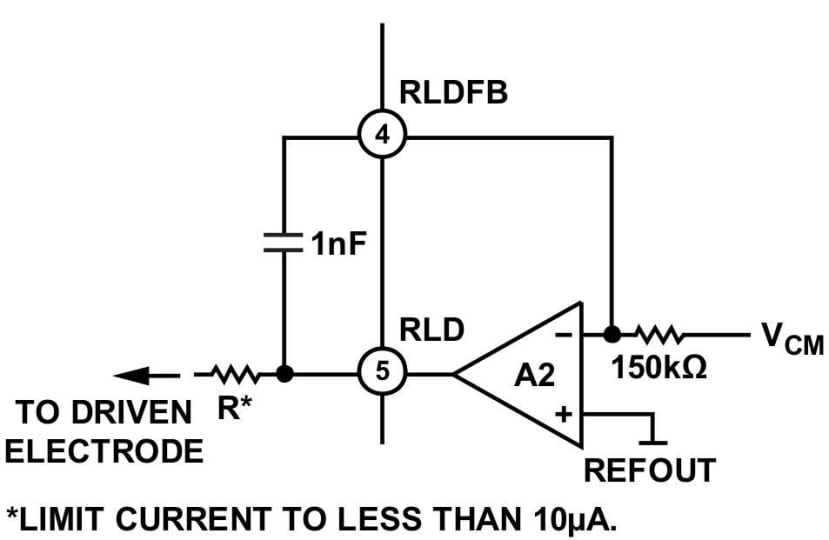
Figure 15. Right-Leg Drive circuit
Performance investigation of ECG circuit
To show the difference between the new ECG circuit and the previous one, an experiment is conducted. The new module filter is designed by AD8232 Filter Design Tool which is produced by Analog Devices. With this tool, users can calculate the resistor and capacitor value to adjust the filter bandwidth.

Figure 16. AD8232 Filter Design Tool by Analog Devices

Figure 17. Module Layout

Figure 18. The new module schematic
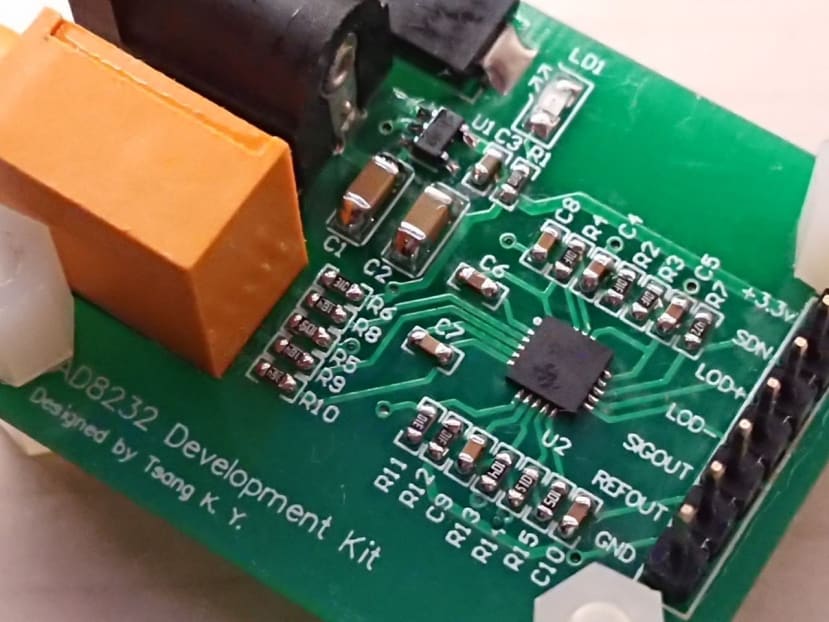
Figure 19. soldered testing circuit
|
|
SparkFun ECG circuit |
New ECG circuit |
|
Still |
 |
 |
|
Walk |
 |
 |
|
Run |
 |
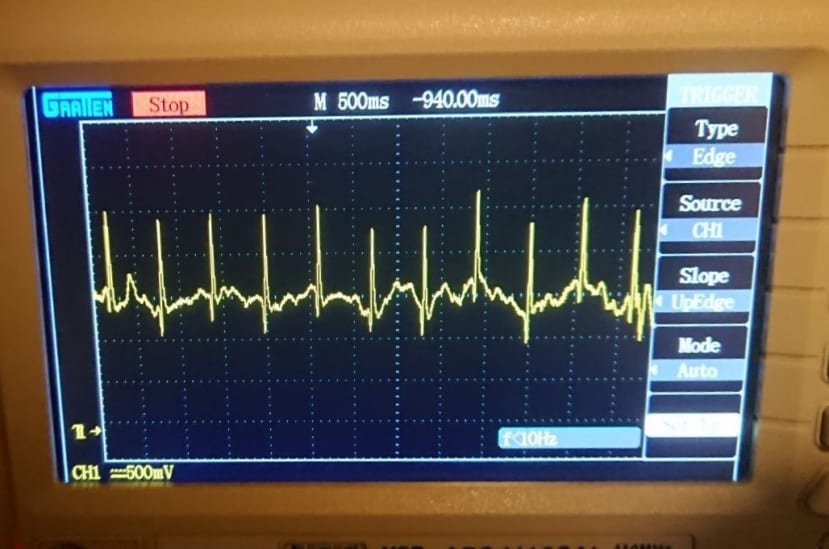 |
Table 2. Comparison of New and Old ECG circuit
From Table 2, we can see the performance of two circuits is similar when the user keeps still. However, once the user walks during the ECG measurement, this motion distorts the P, T peak of ECG signal due to low-frequency noise. When the user jogs during the measurement, the ECG signal is completely distorted. On the contrary, when the user walks, the new ECG circuit can reproduce the ECG signal to a large extent. When the user is jogging, the circuit can retain the QRS complex part. We can conclude that the new ECG circuit with the function of elimination of motion is more suitable for remote ECG monitoring.
ECG hardware
The hardware is based on Microcontroller – STM32F4. There are four major components that connect to the microcontroller;
- STM32F4 connects to an external 16-bit ADC via 3 wire communication and it is compatible with SPI communication protocol. And the external ADC takes part in converting the amplified analogue signal from the AD8232 ECG circuit. Also, the ECG lead-off detection pins are connected to STM32 GPIO to check the electrons connections state.
- STM32F4 connects to an MPU9250 accelerometer via SPI.
- STM32F4 connects to a BLE Bluetooth module JDY16 via UART.
- STM32F4 is responsible to monitor the battery voltage level. Therefore, the battery voltage input is connected to an STM32F4 ADC pin.
18350 Li-ion rechargeable battery, which has a very large capacity (1000mAh) is chosen to be the system battery. Therefore, a charging circuit and li-ion battery protection circuit are included on PCB.
The cost of the ECG hardware is around USD $ 17/HKD $130.
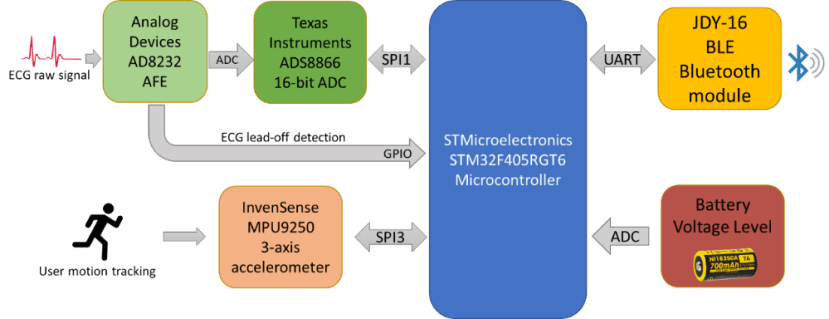
Figure 24. Hardware system block diagram

Figure 25. PCB Schematic diagram
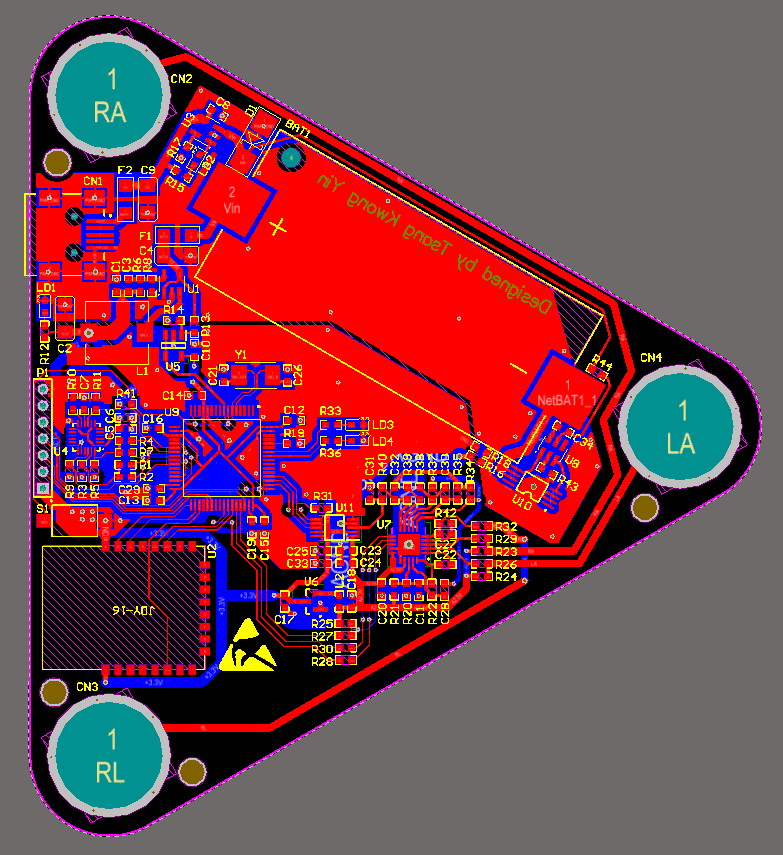
Figure 26. PCB Layout diagram

Figure 27. Soldered PCB
There are three ECG electrons pad sockets on the PCB. User can install three electrode pads and mount the ECG hardware on top of the chest. Besides, there is a 3D-printed case of the ECG hardware.

Figure 28. mount on top of the chest

Figure 29. 3D-printed case
Microcontroller
STM32F405RGT6 is based on high-performance ARM Cortex-M4 core at 168Mhz. Also, it has 192 Kbytes of SRAM and 1Mbtye of Flash. The memory is large enough to store and run different applications. Also, there are a variety of peripherals that is suitable for controlling purpose.
|
Core |
ARM® 32-bit Cortex® - M4 CPU |
|
Dimension |
10mm * 10mm |
|
Flash memory size |
1MB |
|
SRAM size |
192KB |
|
Timers |
Twelve 16-bits and two 32-bit timers up to 168MHz |
|
Debug mode |
Serial wire debug (SWD) |
|
Communication interface |
I2C, SPI, UART etc. |
Table 3. the specification of STM32F405RGT6
Bluetooth module
JDY-16 is a BLE module by a mainland company JDY. The advantage of this component is that JDY-16 is tiny and PCB antenna is embedded on the module. A tiny component can make the final product become more portable. In addition, it is low-power consumption and JDY-16 consumes at most 10mA under maximum power setting.
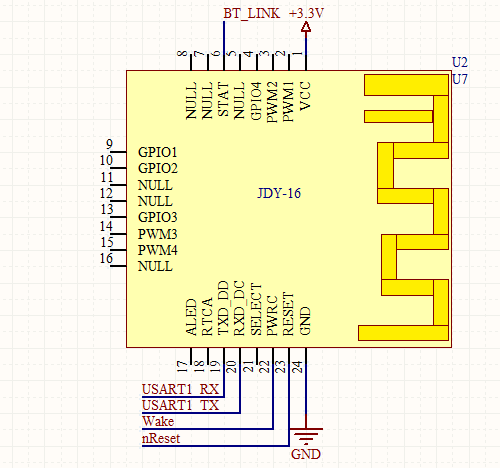
Figure 31.JDY-16 BLE module
|
Transmission power |
≤ 0dB |
|
Communication interface |
I2C, UART |
|
Working voltage |
1.8V - 3.6V |
|
Antenna |
PCB antenna |
|
Operating distance |
≤ 60 meters |
|
Dimension |
14.94mm * 19.6mm * 2.6mm |
Table 4. the specification of JDY-16
AD8232 Analogue Front End
The analogue circuit part already mentioned in Section 2.2. AD8232 has electrons lead-off detection. Once any electrons fall off, a GPIO interrupt is generated by the AD8232. The lead-off detection GPIO is connected to an STM32 GPIO pin.
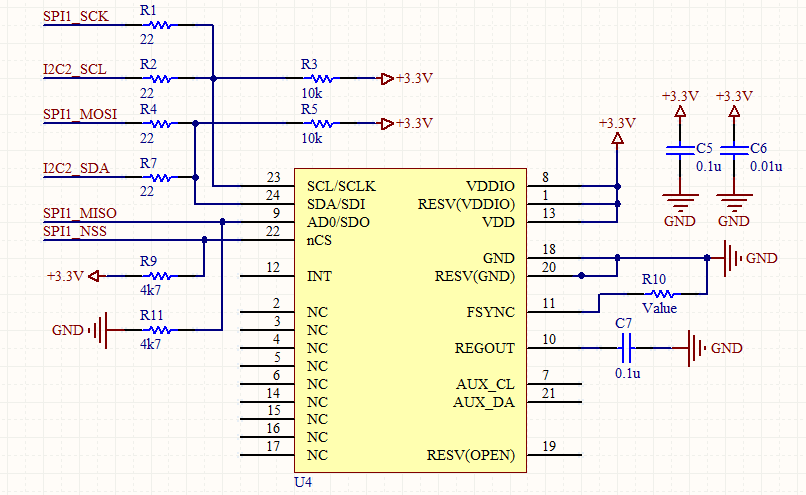
Figure 32. MPU9250 Accelerometer
An MPU9250 from InvenSense is a motion tracking IC and it is chosen as an accelerometer sensor. It is a very tiny sensor and the dimension is around 3 x 3 x 1 mm. An MPU9250 supports the full-scale range of ±2g, ±4g, ±8g, and ±16g, which is suitable for our application.
|
Accelerometer Features |
Programmable full-scale range ±2g, ±4g, ±8g and ±16g and integrated 16-bit ADCs |
|
Communication interface |
I2C, SPI |
|
Working voltage |
2.4V-3.6V |
|
Dimension |
3mm * 3mm *1mm |
Table 5. the specification of MPU9250
ADS8866 16-bit ADC
The ADS8866 is a 16-bit, single-ended input, analogue-to-digital converter (ADC) manufactured from Texas Instruments. Although the maximum sampling rate supported by the ADS8866 is 100k samplings per second and our application needs 360Hz only, the power consumption directly variates to the application sampling rate. Therefore, ADS8866 can keep in low-power consumption. MCU can access ADS8866 via SPI or three-wire interface.
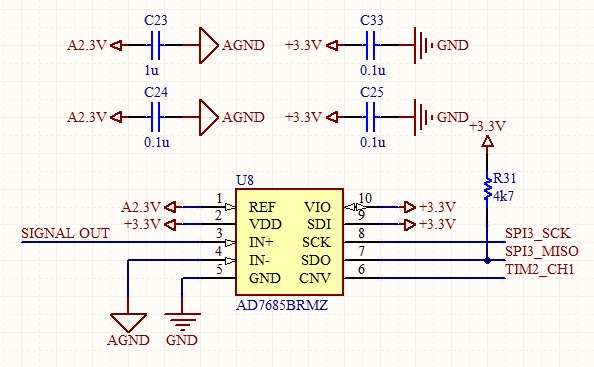
Figure 33. ADS8866
Having a 16-bit high-resolution ADC, the ECG hardware can capture the ECG in detail. Comparing to the device with the 12-bit resolution, the signal converted by our 16-bit ADC has a better Signal-Noise-Ratio (SNR) and less distortion. In Figure 34 and Figure 35, we can recognize the P wave, the T wave and the QRS complex of the ECG signal in a better way under the 16-bit signal resolution.

Figure 34. 16-bit resolution ADC

Figure 35. 12-bit resolution ADC
Battery and Charging Circuit
As previously mentioned, 18350 li-ion rechargeable battery is chosen to be the system power supply. There is a li-ion battery charging circuit built by TP4054 IC on the PCB. Users can plug the mini USB cable to the ECG hardware to charge the battery.

Figure 36. TP4054 Li-ion battery charging circuit
Battery Protection Circuit
Li-ion battery can provide large current (around 3A) output. Once there is a short circuit, the high output current will generate heat which may be harmful to the user. In addition, over-discharge, over-charge and over-current will degrade the battery health. Therefore, battery protection must be considered in this project.
A DW01, a li-ion battery protection IC is added. DW01 limit the li-ion battery voltage in the range of 3.0V to 4.3V in order to prevent an over-discharge and over-charge situation. Also, there are fuses on both the input of the charging circuit and the input of battery to limit the current usage under 500mA and 120mA.
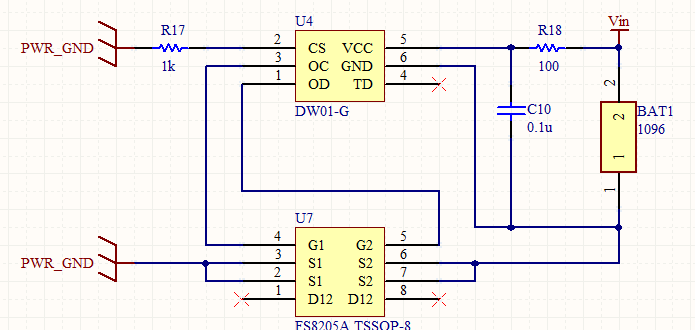
Figure 37. DW01 protection circuit

Figure 38. Fuses on PCB
There are positive and negative markings on the battery socket and the PCB in order to indicate the battery installation direction. Also, a reverse protection diode is added. Once the user installs the battery in the reverse direction, the reverse protect diode limits the input voltage to -0.7V rather than -VCC in order to protect the circuit.

Figure 39. Reverse Protect Diode
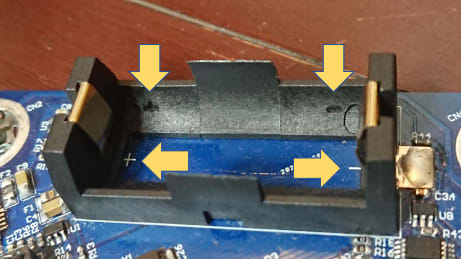
Figure 40. Clear battery markings
Voltage regulation and grounding
The NCP1529 step-down DC-DC converter is chosen as the system power regulator. Having a high switching frequency 1.7Mhz, NCP1529 provides up to 96% power efficiency and less power consumption can help to extend the battery life. The NCP1529 steps down and regulate the li-ion battery voltage to 3.0V to system power.
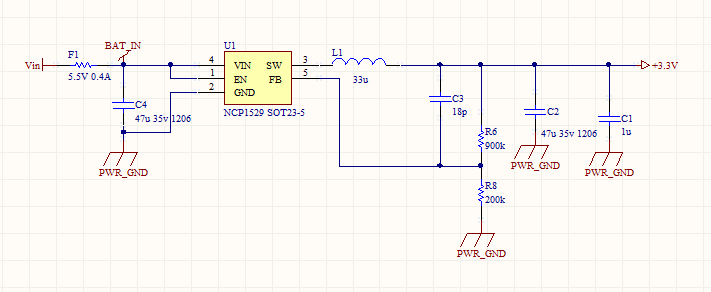
Figure 41. NCP1529 DC-DC converter circuit
To provide a better noiseless environment to the analogue circuit, a linear regulator is added. An XC6206-2.8V is chosen as the analogue circuit power supply i.e., the external AD8866 16-bit ADC and AD8232 AFE. Besides, an LC low pass filter is added to the output of XC6206-2.8V to eliminate the power noise.
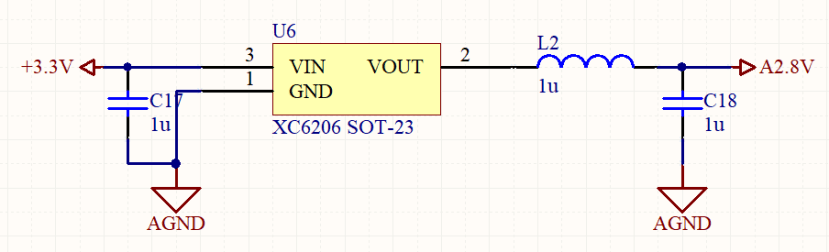
Figure 42. XC6206 linear regulator
To minimise the ground noise, separated grounds [6] and single-point grounding design are considered. There are three grounding in the system and they are power ground, (Digit) ground and analogue ground. Digital ground means that the ground connects to digital signal components such as the accelerometer and Bluetooth module. For analogue ground, it is connected to the AD8232 ECG AFE and the external ADC. The reason for separating ground is that digital signal is a square wave and includes a lot of high-frequency component in it. Therefore, separating ground can help to eliminate the digital noise affecting the analogue components. Both analogue ground and digital ground connect to power ground with zero Ohm resistors near to the battery ground negative side. Besides, ground plane design is applied on the digital ground and power ground to reduce the ground impedance.
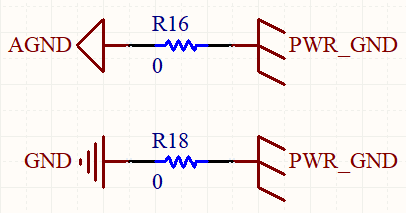
Figure 43. separated grounds and single-point grounding design
Battery Voltage Sensing
A battery voltage sensing circuit is designed in order to indicate the battery level. As Li-ion battery maximum voltage is 4.2V which exceed the STM32 internal ADC range (maximum 3.3V), a voltage divider is added to drop the voltage. Also, an external OP Amp buffer is added and it is driven by the system power supply (3.0V). Once the input voltage exceeds its supply voltage, the OP Amp buffer will limit the output voltage up to its supply voltage (3.0V) in order to protect the STM32 ADC.

Figure 44. Voltage divider and Op AMP buffer
Firmware
The firmware bases on FreeRTOS [7]. FreeRTOS is a real-time operating system kernel for embedded system. FreeRTOS supports multiple threads, tasks, mutexes and software timers. Using FreeRTOS can handle multiple tasks with a single microcontroller.
From Figure 45, there are 5 tasks: one for ADC converting, one for ECG signal processing, one for Bluetooth UART transmitting, one for motion detection and one for battery voltage sensing.

Figure 45. microcontroller program flow chart
Besides, there are timers running in the background for signal converting. DMAs (Direct Memory Access) is widely used for controlling peripherals in order to save CPU loads
From Figure 46, Timer 2 is running at 360Hz which matches the ECG sampling rate. Every 1/360 second, Timer 2 Channel 2 triggers the DMA to send a SPI3 frame to ADS8866 ADC and it returns a 16-bit data frame. When 3600 data frames have been received through SPI3, an interrupt triggers the DMA to indicate that it is the end of the ten-second ECG sampling period and the measurement of the period is completed.
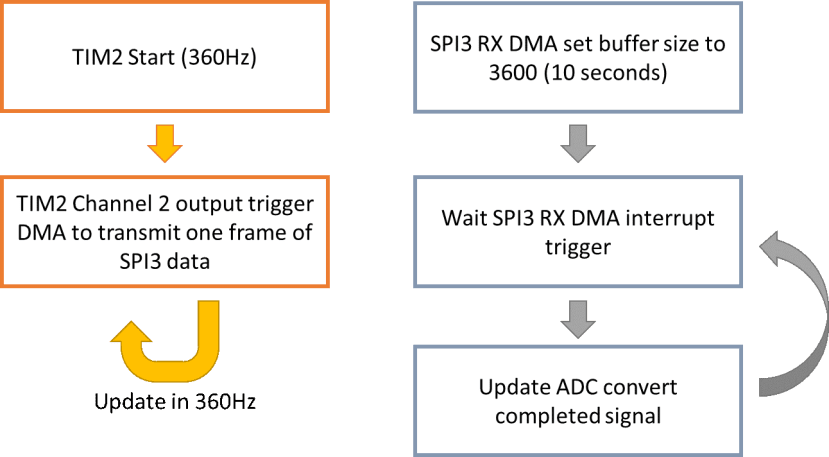
Figure 46. Timer 2 and SPI3 receive DMA program flow chart
Similarly, from Figure 47 we can see that Timer 1 is running at 20Hz and generates a timer interrupt in every cycle. Inside the interrupt service routine, STM32 sends seven-byte data frames via DMA and SPI1 to an MPU9250 to get its X-axis, Y-axis, and Z-axis accelerations. When 420 data frames are received, an interrupt triggers the DMA to indicate that it is the end of the three-second motion tracking sampling period and the measurement of the period is completed.
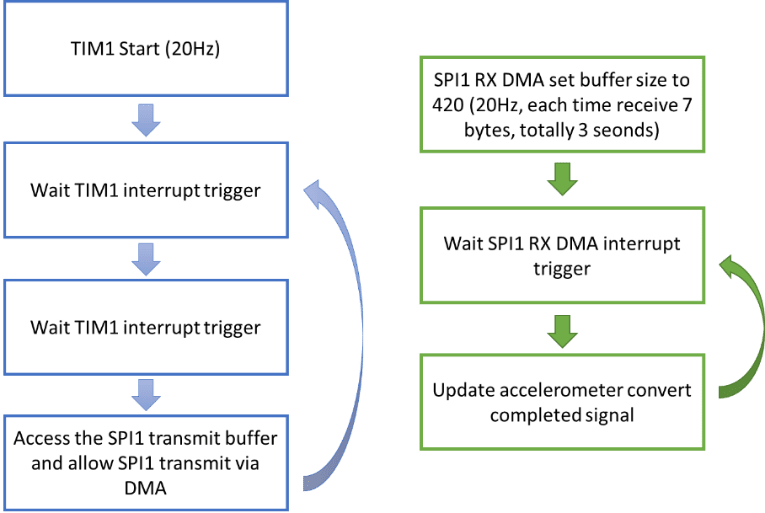
Figure 47. Timer 1 and SPI1 receive DMA program flow chart
From Figure 48, Timer 3 is running at 20Hz and keeps scanning the ECG electron lead-off detection GPIO from AD8232. Once the electron drops, STM32 updates the ECG electron status to users via Bluetooth.
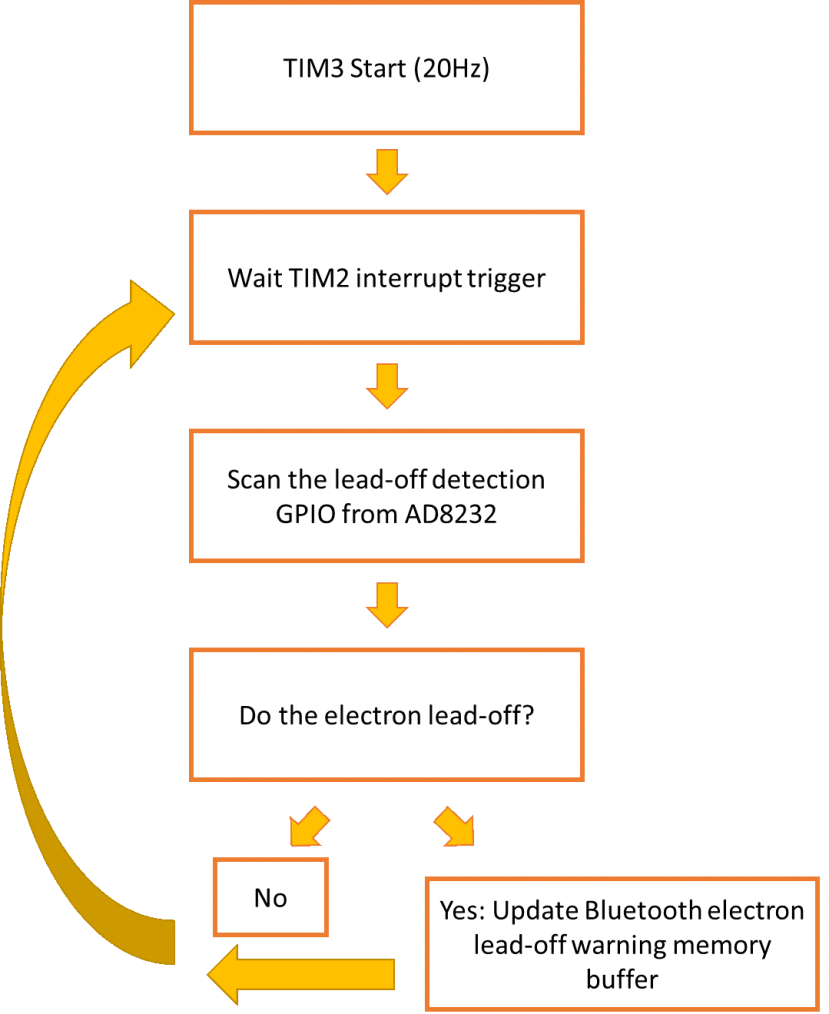
Figure 48. Timer 3 program flow chart
Deep Learning Model and Deep Learning Classifier on MCU
The deep learning model was provided by Dr Sean Xu, a Ph.D. graduate working in deep learning for heart arrhythmia. The deep learning model is designed for classifying arrhythmia from the ECG signal with a 360Hz sampling rate. The Deep Neural Network requires 417 sequential ECG sampling points as input for the input layer. From Table 6, there are five output labels in the output layer, which show the ECG health status. They are Normal beat, Supraventricular ectopic beat, Ventricular ectopic beat, Fusion beat, and Unknown beat. For more details, please refer to Sean’s journal papers - I-Vector Based Patient Adaptation of Deep Neural Networks for Automatic Heartbeat Classification [8] and Towards End-to-End ECG Classification with Raw Signal Extraction and Deep Neural Networks [9].
|
Output labels |
Description |
|
0 |
Normal beat |
|
1 |
Supraventricular ectopic beat |
|
2 |
Ventricular ectopic beat |
|
3 |
Fusion beat |
|
4 |
Unknown beat |
Table 6. Output class description of the deep learning model
In this project, STM32f405RBT6 from STMicroelectronics is chosen to be the system microcontroller. STM32CubeMX [10] is a graphical tool that is provided by STMicroelectronics for setting up STM32 MCU peripheral parameters and generating C libraries. Users can add different C libraries such as the DSP library by accessing the GUI on STM32CubeMX. Undoubtedly, STM32CubeMX facilitates project initiation and project management.
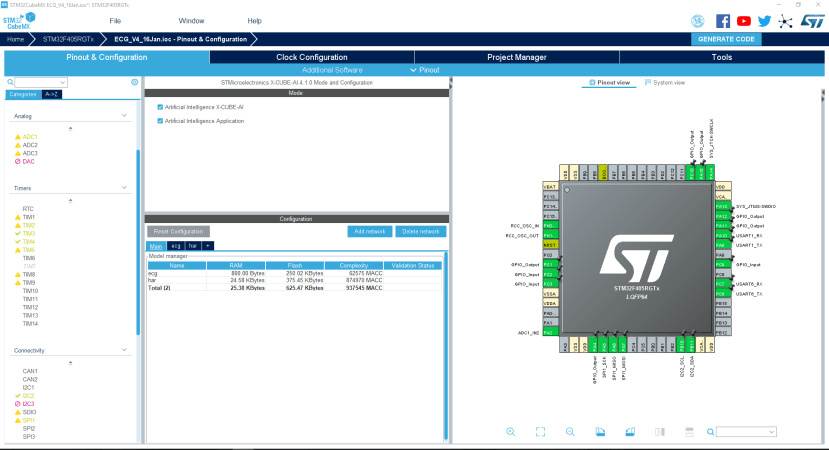
Figure 49. STM32CubeMX

Figure 50 X-CUBE-AI
In STM32CubeMX, there is an expansion package called X-CUBE-AI [11], which is designed for converting pre-trained Neural Network models to an STM32 C library. From Figure 50, we can use X-CUBE-AI to import an AI model into it. Sean’s deep learning model uses Keras with Tensorflow. In the Keras of X-CUBE-AI, a model compression is provided to reduce the size of the C library. In this project, the model compression is not selected to maximize the classification accuracy.
After importing the model to X-CUBE-AI, we can analyze the model. In Figure 51, we can see the analysis result. Besides, we can validate the C library on X-CUBE-AI. We can validate the C library by using a random number or custom data on X-CUBE-AI. X-CUBE-AI generates a report to show the error rate on each model layer compared to the original model. Figure 52 shows the validation result.

Figure 51. Analyze model in X-CUBE-AI

Figure 52. Validation in X-CUBE-AI
In Figure 53, we can see the model in detail. It includes the information of each hidden layer and bias information. On the other hand, we can import some sample data or using random data to validate the model in X-CUBE-AI.

Figure 53. AI model detail shown in X-CUBE-AI
After setting up all the peripheral and AI model in STM32CubeMX, we can generate the microcontroller project file to Keil µVision IDE.
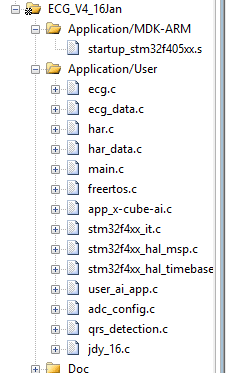
Figure 54. C library in Keil µvision5.0 IDE
From figure 54, we can see the STM32CubeMX generated project file with all MCU C library including the deep learning classifier library – “app_x-cube-ai.c”, “ecg.c” and “ecg_data.c”. There is a performance comparison of the pre-train model classification on STM32 and Python. In this performance comparison, it is expected that the classification results and output label values from Python are more accurate than that in STM32. 20 sets of sample data are stored in the classifiers at Python and STM32.

Figure 55. Raspberry Pi 4

Figure 56. STM32 Nucleo Board
From Table 7, we can see that result of the classifier in STM32 is very close to that in Python. The largest difference is around 0.005%. It shows that the Deep learning classification library generated by X-CUBE-AI in STM32 is almost equivalent to that in Python.

Table 7. STM32 Output label error on a 20 set of sample data
Pan-Tompkin algorithm
We need to detect the R peak position of an ECG waveform before inputting the data to the neural network classifier. It is because Sean’s deep neural network is designed for input 417 sampling each time. It is expected that the R peak should be found in the middle of the samples (i.e., 209th). If the number of samples between two successive R peaks is less than 417 samples, we claim these arrays as an “overlapping array”. In an overlapping array, we should assign zero-value samples to keep the number of samples in each ECG waveform is the same before processing the classification.
Pan-Tompkins [12] algorithm is an algorithm which is proposed by Jiapu Pan and Wills J. Tompkins for detecting QRS complexes. This algorithm was tested in MIT ECG database and the performance are outstanding. The testing report pointed out that more than 99% of QRS complexes were detected with Pan-Tompkins algorithm.
The block diagram of Pan-Tompkins is shown in Figure 57.
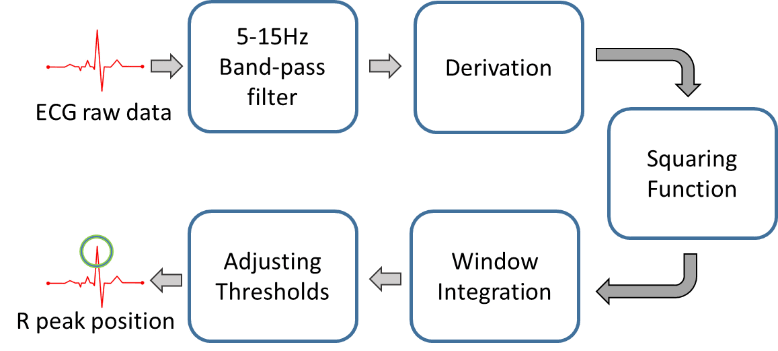
Figure 57. Pan-Tompkins block diagram
2.7 Digital Filter Design
In the previous section, it tells that an ECG signal is required to be passed into a 5-15 Hz band-pass filter before running the R peak catching process. Therefore, we need to design a digital filter for this purpose in the STM32 microcontroller. In this project, a Finite Impulse Response (FIR) filter is selected because the FIR filter is simple and stable. Also, its linear phase characteristics ensure that the ECG signal is not distorted.

Figure 58. Filter Designer in Matlab
Filter Designer in Matlab [13] is a great tool to design an FIR filter. From Figure 58, We can control the UI to input the cut-off frequency and windows selection into it. It shows the corresponding filter frequency response and phase response. Also, it can generate a C header for the coefficients of the FIR filter.
After importing the C header to the STM32 project file, we need to run an FIR filter function in STM32. The simplest way to build an FIR filter is to make use of the Cortex Microcontroller Software Interface Standard (CMSIS) library [14]. STM32F4 is based on Cortex-M4 and the CMSIS library to provide the DSP library to STM32. Appling the DSP library, we can build up the FIR filter easily.

Figure 59. CMSIS FIR filter function applied on stm32
We can see that some high-frequency noises are removed after applying the band-pass filter in Figure 60 and Figure 61.

Figure 60. before band-pass filter

Figure 61. after band-pass filter
2.8 Real life ECG classification on MCU
This section shows the process of ECG classification in an MCU. A sequence of ECG data with arrhythmia from the MIT arrhythmia database (Figure 62) is selected as the sample data.

Figure 62. a sequence of ECG data with arrhythmia from MIT arrhythmia database
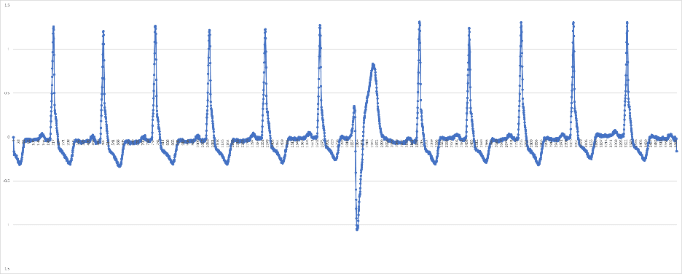
Figure 63. the sample data after derivative

Figure 64. the sample data after square function

Figure 65. the sample data after window integration

Figure 66. the sample data after adjusting thresholding
We can see that the Pan-Tompkins algorithm can correctly detect all R peaks in a sequence of ECG data in Figure 66. After that, each ECG signal is packaged as a 417 array and it is passed to the deep learning classifier on STM32. Based on the result, the classifier identifies an arrhythmia at 1886th sample, which matches the real situation.
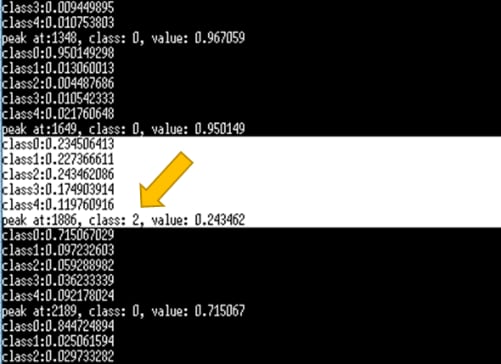
Figure 67. classifier can classify arrhythmia happen

Figure 68. arrhythmia happen on 1886 array position
2.9 Heart rate calculation
In the previous mentions, it tells that the Pan-Tompkins algorithm can detect all R-peak positions in a sequence of ECG signal. Therefore, once we get N R-peaks, we get N – 1 intervals. Then, the calculation of the average heart rate is shown below.

where
AP(i) means the array position of i-th R-peak
N means the total number of R-peak inside 10 seconds
360 means 360Hz, it is the ECG signal sampling rate
2.10 Motion detection
The accelerometer is used to capture the X-axis, Y-axis, Z-axis acceleration in 20Hz, and stored in an array buffer. Every three seconds, the microcontroller processes a total of 180 sets of data.
Root mean square calculation is a method to estimate the vibration from users. The following three pictures show the accelerometer data sequence in three different cases respectively. They are standing still, walking, and running. The green line, red line and the blue line represents X-axis acceleration, Y-axis acceleration, and Z-axis acceleration respectively. We can see that when the user moves violently, the ripple amplitude becomes larger in Figure 69, Figure 70 and Figure 71.

Figure 69. standing still
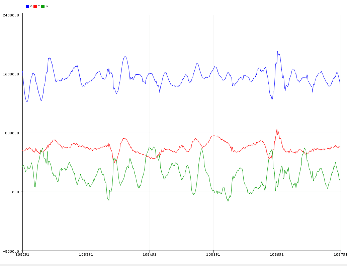
Figure 70. Walking

Figure 71. running
The accelerometer is used to measure the offset angles of the motion of the user on the three axes. Every set of data needs to be normalized based on the offset angles. Then the root-mean-square of the magnitudes of the three axes is calculated and it is used to determine the user’s motion.
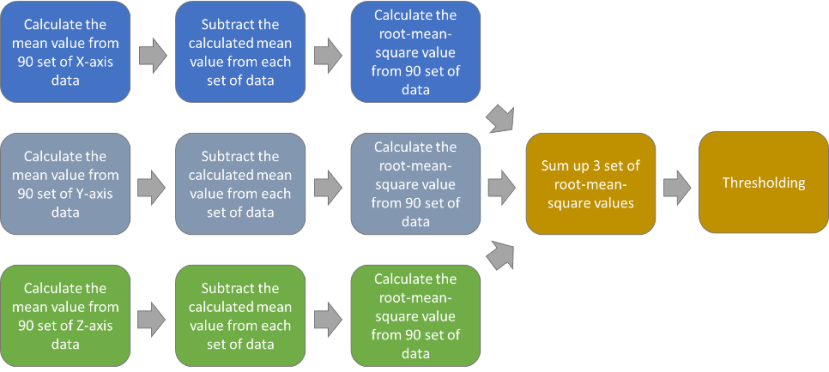
Figure 72. Motion detection calculation process
Mobile App
The phone application was developed on the Android platform.
The phone app has three main functions:
- to receive data from the ECG measurement hardware via Bluetooth,
- to display information showing the real-time ECG waveform, and
- to transmit ECG raw data to server developed for deep AI classification.
The reason why AI classification in both MCU and on the online server was that the development of online classification is mature. This solution was proven last year. Therefore, the performance of MCU classification can be compared to that of the online server.
In order to speed up the development process, different android libraries were adopted in the phone app:
- FastBle: to handle the Bluetooth communication,
- MPChart: to generate real-time ECG waveform diagram and display, and
- Async-http: to make and receive http requests
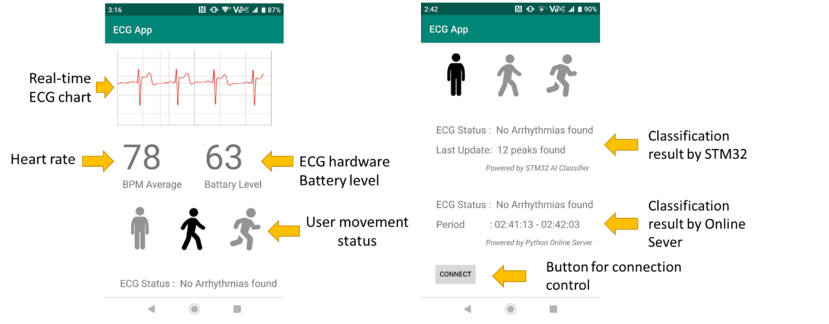
Figure 73. The ECG phone app UI introduction

Figure 74. Mobile app program logic diagram
Discussion
3.1 Performance investigation
This section contains the study of ECG hardware performance in real-life.
First, the hardware performance would be demonstrated understanding still, walk and run conditions. Followed by the performance test on the heart rate calculation.
3.1.1 ECG sensing function
As mentioned in the previous section, the ECG hardware is mounted on top of the user’s chest with three-electrode pads.
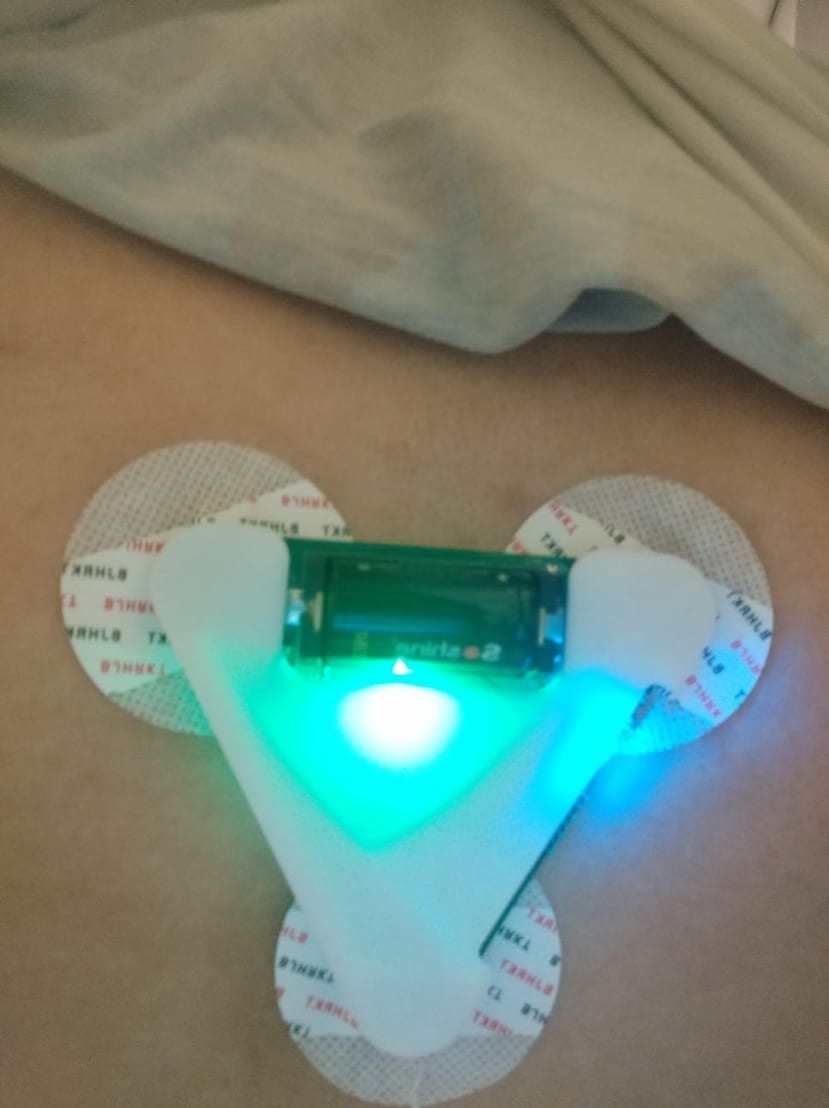
Figure 75. ECG hardware is mounted on user’s body
Standing Still
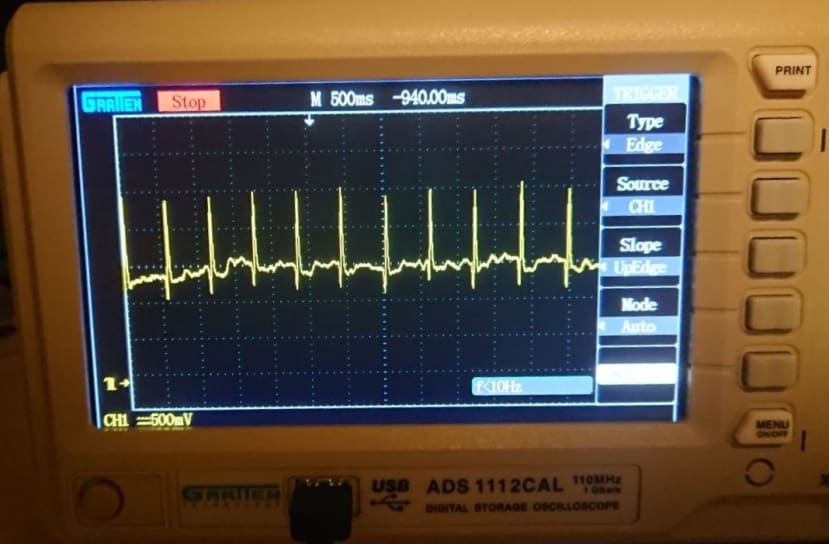
When the user stands still, the ECG hardware can get the ECG waveform with the minimum distortion. In Figure 76, the ECG waveform is noise-less and we can recognize the P wave, QRS complex, and T wave of ECG waveform clearly. Also, the hardware can identify correctly that the user is standing still.
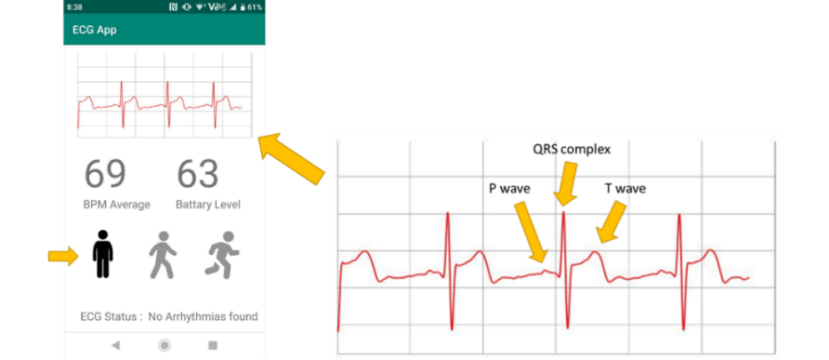
Figure 76. ECG hardware performance under user standing still
Walking
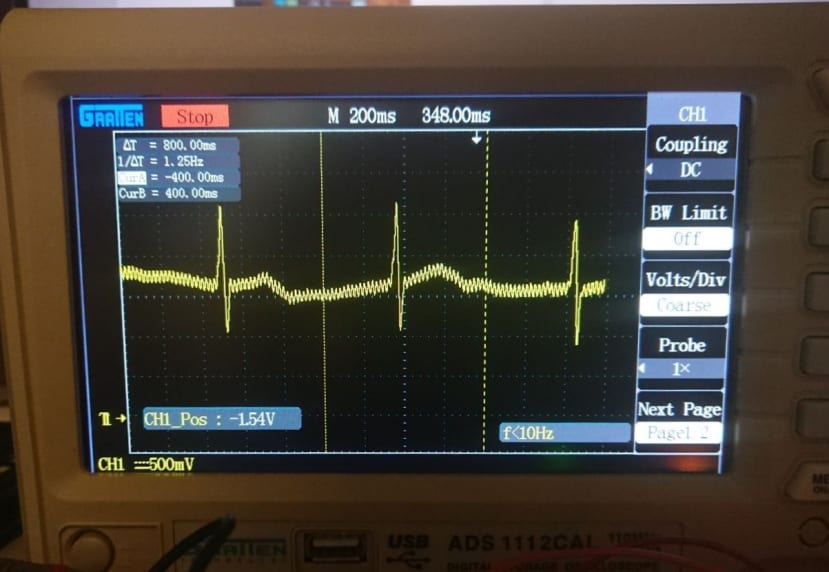
When the user walks during the measurement, the heart rate increases and thus the ECG hardware can recognize that the user is walking. In Figure 77, we can see that there are some ripples inside the ECG waveform due to the body movements. In this part, ECG AFE is used to eliminate the motion effects and thus most of the ECG signals can be figured out. Although some of the P waves are distorted, most of the QRS complexes and T waves can still be observed clearly.

Figure 77. ECG hardware performance under user walking
Jogging
When the user is running, the quick body movements generate noise and cause motion effects. In Figure 78, we can only recognize the QRS complex clearly when the user is jogging. Motion effects generate a lot of large-scale ripples and distort the P wave and T wave. The good thing is the calculation of the heart rate is still valid because the QRS peak can still be recognized properly.

Figure 78. ECG hardware performance under user jogging
3.1.2 Deep learning classification
To test the classification performance in the ECG measurement device, another ECG experiment is carried out in a real human body.

Figure 79. ECG hardware is mounted on my chest
In Figure 80, we can see that 12 heart beats are measured in 10 seconds. With the 360Hz sampling frequency, the MCU receives total 3600 sample data points and they are stored in an array.

Figure 80. ECG hardware is mounted on my chest
After that, the MCU locates all R-peak positions. In Figure 81, the Pan-Tompkins algorithm is used to find out 11 of them. Noted that, the first R-peak is neglected. It is because this R-peak position is in 190 and thus it cannot form a complete 417-sample array of ECG data for the algorithm to locate the peak.

Figure 81. Pan-Tompkins algorithm find out 11 valid ECG samples
Then, all ECG waveforms are loaded into the classifier and output labels are generated by the classifier. The classification result is listed in Table 8. It shows that the MCU can classify all 11 ECG samples as class 0 (normal beats).
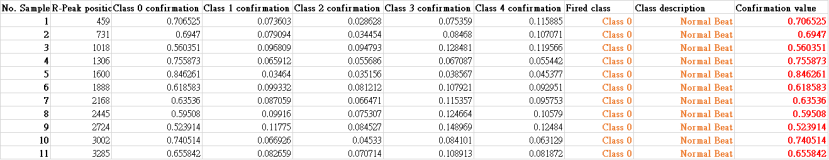
Table 8. The classification result in detail
Then, the ECG waveforms and the classification results are sent to the mobile app. There are no abnormal beats in this sample set and the mobile app shows the message “No Arrhythmias found” in Figure 82. Meanwhile, the mobile app sends the Raw ECG data to the online server and gets back the classification result via HTTP request. The classification results from the online server are also shown in the mobile app.

Figure 82. Pan-Tompkins algorithm find out 11 valid ECG samples
3.1.3 Heart rate calculation
This section will focus on testing the heart rate calculation accuracy. The setting of this test is that users use ECG hardware and Mi Band 3 at the same time. Mi Band 3 is an electronic smart band with heart rate tracking function. Then, there is a heart rate compression to these two devices.

Figure 83. ECG hardware heart rate calculation and the Mi Band 3
|
Test Number |
ECG hardware |
Mi Band |
Difference between the two devices. |
|
0 |
64 |
64 |
0.00% |
|
1 |
65 |
68 |
-4.41% |
|
2 |
67 |
66 |
+1.52% |
|
3 |
71 |
72 |
-1.39% |
|
4 |
71 |
70 |
+1.43% |
|
5 |
84 |
88 |
-4.55% |
|
6 |
83 |
88 |
-5.68% |
|
7 |
83 |
79 |
+5.06% |
|
8 |
87 |
85 |
+2.35% |
|
9 |
84 |
80 |
+5.00% |
|
10 |
80 |
83 |
-3.61% |
|
11 |
96 |
90 |
+6.67% |
|
12 |
100 |
104 |
-4.00% |
|
13 |
103 |
100 |
+3.00% |
|
14 |
100 |
95 |
+5.26% |
Table 9. Heart rate by ECG hardware and Mi Band
From Table 9, we can see that the heart rate detection performance of these two devices is roughly the same. For ECG hardware, it will measure heartrate in every 10 seconds, while Mi Band 3 takes 20 seconds to complete a heart rate checking. Therefore, there are errors in the result due to the different sampling periods in the two devices.
- ECG lead-off detection
As section 2.2 mentioned, there is ECG electrode lead-off detection function inside AD8232. Therefore, once any electrode comes off, there will be a notification in the phone App to remind the user to install the electrode properly.

Figure 85. ECG electrode lead-off notification on phone App
3.1.5 Battery charging
The ECG measurement device requires 5V and 0.5A for charging. When the user plugs in the device to the mini USB cable, an LED indicates that the device is charging. Once the battery is charged to 4.2V, the device stops the charging process automatically and switches off the LED.

Figure 86. ECG hardware is charging and ECG hardware finishes charging
3.1.6 Power Consumption
The ECG measurement device is highly energy-efficient and consumes only about 75mA and 0.3W of power. Using a 1000-mAh 18350 rechargeable li-ion battery, the ECG measurement can last for more than 13 hours.
Conclusion
To conclude, I successfully developed a new generation ECG hardware with great ECG function and compact design. In addition, I have enriched the local processing functions on the ECG hardware and developed a phone application that can provide users with more real-time information. More importantly, the whole system can remain low cost with automatic diagnostic function. I hope it can help people detect heart disease early.