OKdo ROCK 4C+ temperature under different loads
Follow article Dave from DesignSpark
How do you feel about this article? Help us to provide better content for you.
Dave from DesignSpark
Thank you! Your feedback has been received.
Dave from DesignSpark
There was a problem submitting your feedback, please try again later.
Dave from DesignSpark
What do you think of this article?
1. Introduction
After being selected to receive an OKdo ROCK 4C+ starter kit, different projects came to my mind. Most of them like Pi-Hole, Home Assistant or a Media Center are already running in a MiniPC used as a home server, so the chosen option was finally Bitwarden.
There are two different approaches to this:
1) Install as a Docker container.
2) Install Rust implementation, without Docker.
Unfortunately, none of the approaches has been working for me yet. Future debug will be carried out until finally being able to run Bitwarden. However, as I decided to measure SOC and GPU temperature, useful data was obtained.
2. Materials and methods
OKdo ROCK 4C+ Starter Kit.
A great unboxing has been already carried out by awneil, so there is no need to repeat it again, just follow the link! Anyway, some things to take into consideration:
- For me, the package arrived damaged too. The kit was ok.
- Starting guide needs to clarify why there are so many heatsinks included.
- I didn't use a screen. Starting guide needs a section about SSH connection (user rock, password rock).
Regarding the board:
- The fan is noisy enough to disturb in a quiet room. It is always running under 5V, it should be connected to a GPIO and only run above a desired temperature.
- After a power outage, I cannot access the board. I don't know if it's just Wi-Fi not coming back or the board not booting properly. A manual power cycle solves the issue.
The provided case results in a really cool look, with cooling holes, as depicted in Figure 1.
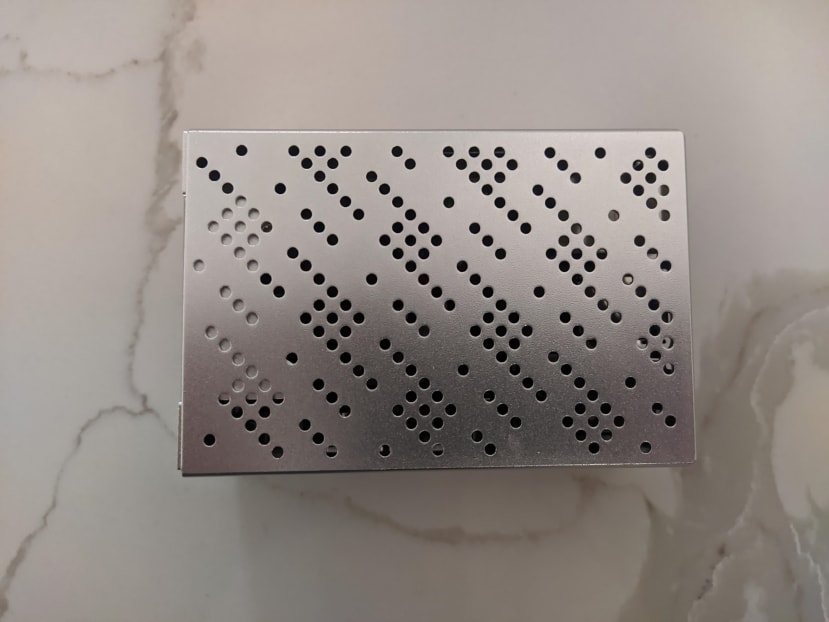
Figure 1. Above view of the board inside the case
The code used to log the temperature was really simple:
while true
do
  cat /sys/class/thermal/thermal_zone*/temp >> log
  sleep 60
done
The sleep bit was modified in different case studies. While 60 seconds sleep was used under load, when the board was idle the temperature was measured each hour (3600 seconds). This was done as under load any temperature increase would be logged if checked every minute, and when idle any increase was not expected.
The results obtained must be divided by 1000 in order to get the temperature in the expected format. The first thermal zone is the SOC and the second thermal zone is the GPU.
3. Results and discussion
3.1. Case study 1
First, temperature of the CPU was measured overnight with the board in idle state. The results obtained are present in Figure 2.

Figure 2. Idle state temperature measurements
As expected, the provided fan maintains the board within approximately a temperature differential of 2 °C. Some temperature increases are observed due to the scaling employed, not being significant.
3.2. Case study 2
The build load test was performed trying to install the Rust implementation of BitwardenRS, following this tutorial. The results obtained are present in Figure 3.
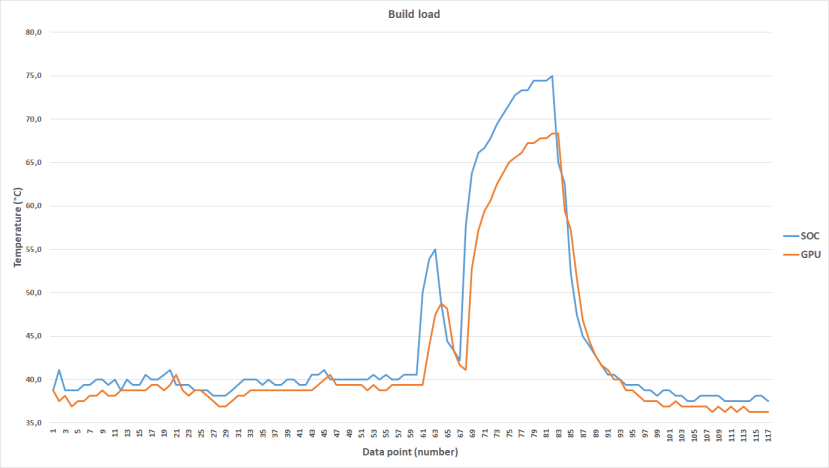
Figure 3. Build load temperature measurements
In this case, two different peaks can be observed. The first one can be attributed to the cargo clean process, while the second one is related to cargo build. Regarding the differences between SOC and GPU, not only the maximum temperature is lower for the GPU, also the peaks occur slightly later.
3.3. Case study 3
Finally a test was performed while trying to install Docker, following the official method. The results obtained are present in Figure 4.

Figure 4. Install load temperature measurements
For the installation process, the obtained peaks are just a few degrees above the idle temperature. The findings obtained in the case study 2 are confirmed, namely the lower temperature and the delayed peak for the GPU.
4. Conclusions
The results obtained after performing of these experiments are listed below:
- The active fan provides a constant temperature while idle or under low load.
- The temperature under intense load (build) peaks at 75 °C, far away from the maximum 125 °C allowed by the chip [1] but close to the defined limit before throttling [2].
- The GPU is approximately 5-10 °C cooler than the SOC.
- The temperature increase for the GPU occurs slightly later than for the SOC.
5. Future work
As it has been explained, OKdo ROCK 4C+ starter kit is a promising SBC kit with an active cooling system.
- Perform a full temperature stress test.
- Compare obtained temperatures with CPU load percentages.
- Substitute provided fan with a PWM capable one.
6. References
[1] https://dl.radxa.com/rockpi4/docs/hw/datasheets/Rockchip%20RK3399-T%20Datasheet%20V1.0-20210818.pdf
[2] https://docs.rs-online.com/8345/A700000008186849.pdf
Annex I – Minimum and maximum temperatures

Figure 5. Minimum temperatures in all the case studies

Figure 6. Maximum temperatures in all the case studies