New Features added to Air Quality Device User Interface
Follow article
 Dave from DesignSpark
How do you feel about this article? Help us to provide better content for you.
Dave from DesignSpark
Thank you! Your feedback has been received.
Dave from DesignSpark
There was a problem submitting your feedback, please try again later.
Dave from DesignSpark
What do you think of this article?
Air Quality device application user interface updates add metric charts and debugging information.
In this article, we’ll be taking a look at the new UI features present in the Air Quality device application and their implementation. We’ll also take a look at how to update to enable the new features.
Metric Charts

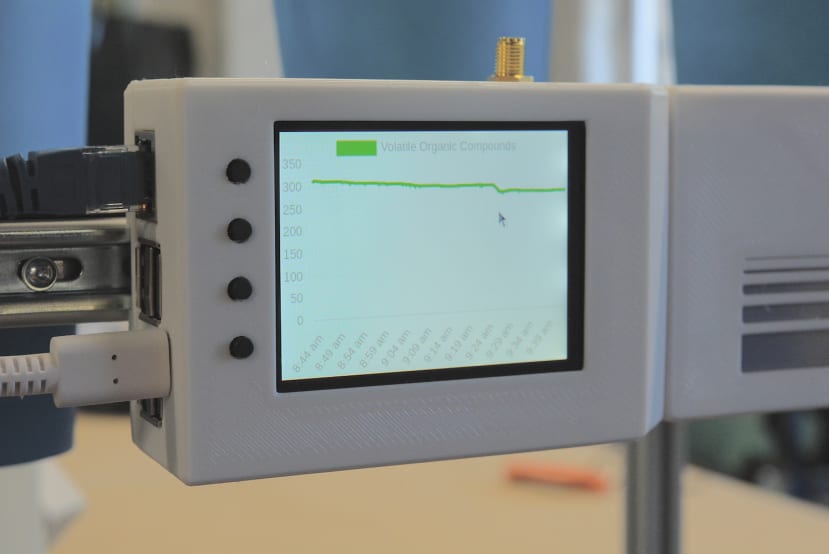
By far the most exciting feature in the small handful of UI updates is the addition of charts that display the last hour of data from each of the sensors. A big thanks to GitHub user “Elleo” for making a pull request against the aq-device repository to implement these updates!

Charts are accessed by tapping on each of the metric tiles, which replaces the usual screen with a chart of the last hour’s worth of sensor readings. A tap on the chart restores the home screen.
The charts are implemented using a JavaScript library called “chart.js” that produces beautiful looking HTML5 charts, utilising the canvas element which offers excellent performance across browsers.
As the charts are drawn onto a canvas, this allows for responsiveness when changing the browser viewport size — this will allow us to provide a suitably laid out UI to desktop and mobile clients accessing the Air Quality device interface, without much change to the existing code.
Behind the scenes, a number of data buffers are created that keep track of sensor readings. Every time a sensor data object is received over the WebSocket connection, the object is broken down and data pushed into the appropriate buffer. The push function is built into JavaScript and appends data to the end of an array, meaning that in combination with the shift function a FIFO buffer can be implemented.
A call to the trimData function that Mike has implemented is made every time new data is received on the WebSocket. This function looks at the first item in a provided data buffer, compares that to the maximum data age and then shifts the data out if it is older — effectively discarding the oldest data point. By default, this is set to one hour, but can be modified by changing the 3600000 value in the call to trimData (the time value is expressed in milliseconds).
Debug Screens

Building upon the work that Mike had done to implement screen swapping, we extended the UI to support debug information; including the hardware ID, software versions, physical device location coordinates, used space on the /aq partition, Raspberry Pi power throttle status, and the last (un)successful remote write timestamp.
As a debug page had previously been implemented for testing, the groundwork for integrating this into the UI was already there. Functionality was added to the AQ Python application to support reading the used space on the /aq partition, and then providing remote write timestamps for successes and failures.
var mouseDown = false;
$('.metric')
    .on('touchstart mousedown', function(e) {
        mouseDown = true;
        timeoutId = setTimeout(function() {
            if(mouseDown) {
                // Held down for timeout value
                $('#summary').hide(0);
                $('#debug').fadeIn(250);
            }
        }, 1000);
    })
    .on('touchend mouseup', function() {
        clearTimeout(timeoutId);
        mouseDown = false;
    });
A small amount of JavaScript was written to implement long-press detection, which then enters the debug screens. As jQuery was included for handling the charts, we could make use of the selectors offered to make the code neater and more compact.

The long-press detection works by watching for a mousedown or touchstart event, and then setting a variable to true, and starts a timeout that expires after one second. If the timeout expires, the code checks to see if the variable is true then proceeds to swap the visibility of the <div> used for the home screen and debug pages. If the press is released before the timeout expires, this is treated as a click event and will instead open the metric graph.
A short tap swaps between the two screens of debug information and a final long-press on either screen returns back to home.
Enabling the New UI Features
At present, the new UI features are still under development and subject to change, hence are located on the “development” branch of the aq-device GitHub repository.
To swap to the development branch, the first step is to login to the Pi over SSH and navigate to the aq-device directory.

Run the command git fetch to pull down any changes (but not merge them over the local copy) and then git branch -va to check if the development branch is visible. To switch to the development branch, run git checkout development then run git pull to pull in the changes.
Should the git pull fail due to local changes to files, these can be discarded with git checkout -- ., and then the pull repeated. Alternatively, these changes can be stashed and reapplied as detailed here.
One final set of changes needs to be made if running the latest AQ Raspberry Pi image — the browser needs to be changed to Chromium from Midori (this was introduced to work around bugs in the latest Chromium version).
To do this, open the file /etc/xdg/lxsession/LXDE-pi/autostart as root in your preferred text editor. Comment out the line that starts with midori and add an additional line containing the following:
chromium-browser --display=:0 --disable-gpu --incognito --kiosk --window-position=0,0 file:///home/pi/aq-device/dashboard/dash.htmlSave the file and power cycle the ESDK — the new UI should then load when the Pi starts up.
To Finish
In this article, we’ve taken a look at the new features present in the developmental Air Quality device user interface that includes charts of an hour’s worth of metrics for each sensor and debug screens that provide diagnostics information. The addition of charts enables an at-a-glance view of metric trends, such as rising CO2 levels in a room.
We’d like to encourage people to make pull requests to the “aq-device” repository with improvements and new features, as this will help make the ESDK platform better for everyone.