How to measure signals buried in noise
Follow article
 Dave from DesignSpark
How do you feel about this article? Help us to provide better content for you.
Dave from DesignSpark
Thank you! Your feedback has been received.
Dave from DesignSpark
There was a problem submitting your feedback, please try again later.
Dave from DesignSpark
What do you think of this article?
Have you ever tried following a conversation when there is lots of noise around you? There we can see the problem. The "noise" might be chaotic, like water running down a waterfall. Or it might be others communicating in parallel. So from your point of view, the parallel communication is "noise", while for your fellows following this parallel communication, it is a "desired signal". This is why I would instead call these unwanted signals "disturbances" while "signal" terms the information I desire to gather.
SNR
Disturbances can bury signals. There are sophisticated mathematical calculations to express this fact. I do not want to get too theoretical, but to give you an idea of the mathematical relation between signal to noise ratio (SNR) and possible information content of the signal, think of analogue to digital conversion: The quantisation error behaves like noise. To gain information of 4-Bit depth, we need 4-Bit quantisation. 4 Bit equals 24dB (4 x 6dB). So an SNR of 24 dB allows a theoretical maximum of 4 Bit information (possibility to distinguish 16 different states/amplitudes).
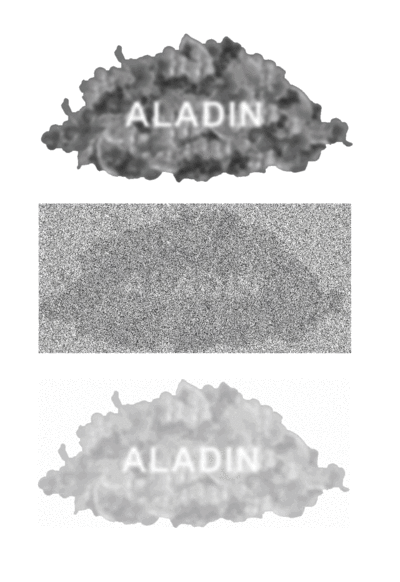
To make my explanation more visual, I decided not to show typical waveforms but images instead. Images also do have signal and noise. When we reduce the resolution in the x and y direction by either blurring the picture (first three examples) or using fewer pixels (second three examples), you can see that there is a threshold where disturbance (the flower background) are killing any desired signals (letters). Such a process is irreversible - the information is lost forever and cannot be restored.


So what can we do if the SNR is poor and the signal is buried in disturbances?
Signal amplitude
SNR is defined as the ratio of the signal power over the disturbance power. Power is proportional to the squared mean voltage ("effective voltage"). So changing the signal's or disturbance's amplitude changes the SNR drastically and, therefore, should be the prior consideration.
If there is any possibility to increase the signal amplitude (i.e. you have not yet used the full dynamic range of your signal path), you should do so. Traditionally, a superb way of raising the amplitude of an AC signal is using a transformer. However, it is always wise to move any signal amplification as close as possible toward the signal source. Of course, you could also lower the disturbance amplitude if possible (e.g. by using more effective shielding). If the disturbance is mainly caused by thermal noise, reducing the temperature and lowering the impedance of your signal path may help. This is because the power of thermal noise is directly proportional to the temperature and the source impedance. But remember that we are talking about absolute temperature. So lowering it from 50°C to 25°C does not halve the noise but lowers the temperature and thereby the noise only by 25 K / 323 K = 8%. On the other hand, lowering the impedance from 1 MOhm to 500 kOhm halves the noise (power).
Filtering
If our signal frequencies are limited, we can cut off disturbances with different frequencies. This technique has traditionally been used in telephone communication: the human voice as a signal contains most information below 3 kHz frequency. So adding a lowpass filter cuts off disturbances with higher frequencies and thus enhances the SNR. However, in high-quality audio equipment, high-pass filters do sometimes cut off deep frequency rumbling disturbances. For example, medical equipment like ECG or EEG uses notch filters to get rid of 50/60 Hz mains disturbances selectively.
Let's get back to our visual examples. This time I have added Gaussian noise to the first image. The desired information (letters) are challenging to detect in the second image. But after applying a high low pass filter (reducing the fast colour or brightness changes in x and y direction), I can restore an image with a much better SNR. The third picture has been created from the second one by using a mild blur filter, and the fourth picture has been created using a digital low pass filter.

Once you have digitalised the signal and its added disturbances, you can, of course, use the whole palette of digital signal processing – mainly all kinds of filtering starting with simple methods like running mean values. Be aware that digitalisation may introduce additional disturbances like aliasing (see below).
If the disturbances are different from "white Gaussian noise" (completely random) but contain repetitive patterns, you can use adaptive filtering. The filter "learns" what is background (disturbance) and subtracts it from the signal. Such filters are typically realised as digital filters in a DSP (digital signal processing)-path. Remember my example at the beginning of this article? When you have a conversation at a party and many other people communicate in parallel, your brain uses adaptive filtering to remove disturbances.
Using spatial information: signal correlation and matched filter
Let us use the "party-communication" as a perfect example for signal correlation filtering. We have two ears, and the signals from both ears differ (they are called "binaural" or "stereo" signals). This enables us to extract spatial information from the two signals: We can tell the direction of the sound source by comparing the phase shift ("propagation delay") of both signals. Our brain uses this information to enhance the signal from the direction we are looking. Thus, it diminishes the disturbances coming from behind or the sides. Technically we could use the first signal (closer to the source) and observe the second signal to find a delayed signal matching the first one. This is (very simplified) what a matched filter does. It needs a known signal and correlates this signal to the unknown signal to find matching patterns. A reduced way of using this concept is a "lock-in-amplifier": It performs a phase-correlated rectification by knowing the signal's phase. While amplifying phase synchronous signals, it reduces all off-phase signals. Typically radar systems use matched filters to detect the small reflected signal (echo) of the signal it has sent a moment before (=known signal).
Repetitive triggered signals
When I researched many years ago, we measured tiny biological currents of a view pico Ampere. The only way to unbury them from the noise of our amplifiers is called "averaging". The small currents were answers to a trigger signal we electronically injected. So we could measure a similar repetitive signal overlayed by random noise dozens of times. When you add all these measurements, the signal amplitude will increase by the number N of repetitions. Any random noise amplitude ("white noise"), which is not correlated to the trigger, will not increase (on average). The SNR is enhanced by 10 log (N²/N). For 100 repetitions, your SNR is increased by 20 dB. By the way: Averaging is nothing else but a phase-correlated amplification.
I tried to use the visual example again but this time simplified the things by using greyscale only. The first image was mixed with Gaussian noise. This makes it difficult to read the letters in the resulting second image. But producing eight such noise images (each generated with different noise) and mixing them results in the third picture, a perfect reconstruction of the noise-free image.
So this is a straightforward and effective way to increase the SNR. But you need to be aware that your system must capture the small signal buried in noise. Take the following extreme example:
Your signal has an amplitude of 1 mV and is buried under noise of 10 V amplitude. If you are using an ADC with a 0-10 V input range and a 10-bit resolution, the smallest signal captured by this system would be 10 V /1024 (about 10 mV). Even averaging a million times would not enable you to see the 1-mV-signal because it is smaller than the ADC resolution. But using a 16 bit ADC would theoretically enable you to capture signals as small as 10 V /65536 (about 150 µV). It would theoretically capture your 1 mV signal with nearly 3 Bit. Using 100,000 samples for averaging would enhance the signal noise amplitude ratio from 1:10,000 to 10:1. Averaging naturally needs time for N measurements and thus is often not suitable for signal detection tasks with a high demand for responsiveness.
Avoiding noise from aliasing
Aliasing is a false signal not contained in the original data but is faked by how we do analogue to digital conversion. The conversion is done by taking samples of the input signal periodically. If the period of sampling is too slow for the changes of the signal, aliasing happens. As a visual example, take your webcam and hold an electric drill in front of it. Then slowly increase the speed of the drill. Watching the webcams video stream on a monitor will show funny effects. The drill seems to slow down or even change its direction. This is because the webcam periodically samples pictures of the drill. If the movement of the drill is too fast compared with the sampling period, we will see "alternative facts" on our monitor - things that never happened but appear as reality.
Whenever you use a sampling ADC in your signal path, you must be aware that any signal frequencies higher than ½ of the sampling frequency will inject aliasing noise into your converted signal. Using a Delta-Sigma-ADC complicates aliasing even more (please watch this video from TI if you want to know more about this topic).
So always use an anti-aliasing filter (low pass) with a cut-off frequency well below the ½ sampling frequency ("Nyquist" frequency). Let's take an example of a wrong choice:
Your 14 Bit ADC has a dynamic resolution of 14 x 6 = 84 dB. It converts 1 sample per µs (1 MHz sampling frequency). You have chosen a 2nd order lowpass filter with a cut-off frequency of 100 kHz. As a 2nd order filter has a roll-off of -40 dB per decade, any 1 MHz signal content will be reduced by -40 dB. This value is far below the 84 dB resolution of our ADC. Thus we would reduce our effective resolution by over 7 Bit (42 dB) because the last 7 Bit of the signal would be buried in aliasing noise (if the signal contains frequencies higher than 500 kHz). The right choice to keep a 14 Bit accuracy would have been, e.g. using a 4th order lowpass with -80 dB roll-off and 50 kHz corner frequency.
If you are inspired by this article or would like to add some of your experiences with detecting small signals, please leave a comment so we can share and learn!