DNOC Windfarm proposal
Follow article Dave from DesignSpark
How do you feel about this article? Help us to provide better content for you.
Dave from DesignSpark
Thank you! Your feedback has been received.
Dave from DesignSpark
There was a problem submitting your feedback, please try again later.
Dave from DesignSpark
What do you think of this article?
DNOC windfarm proposal in Stirling
As the geopolitical dynamics of the worlds keep changing, the access and production of energy keeps being one of the biggest challenges faced by the population. With the acceleration of climate change and its obstacles, the transition to clean energy production must be one of the priorities going forward. Investing on windfarms and wind energy generation is one of the ways this could be achieved. This article describes DNOC’s proposal for an 18 wind-turbine windfarm with capacity of 64.8 MW. The windfarm would be installed in Scotland in the northern area of Stirling.
Site Selection:

Figure 1: Selected site.Site coordinates (52.059273°, -3.549055°)
Figure 1 illustrates the site location chosen for the Windfarm. It is situated in Scotland in the vicinities of Stirling. The location proved to be ideal for the windfarm as it includes many of the optimal characteristics needed for the construction of a windfarm. Such characteristics include significant distances from residences to not impact people’s livelihoods, high wind speeds to maximise the power generation of the turbines, low icing to increase turbine efficiency, appropriate topographical ground to allow for the construction of the windfarm safely and without any delay. Moreover, the area has already been an ally for windfarms in the past, as there already exists a windfarm in the locality and multiple firms plan to invest for the expansion of the sector in the surroundings, therefore proving the suitability of the area and facilitating the process of obtaining licenses and permissions.
To further assess the suitability of the site, a social impact investigation and an Environmental Impact Assessment (EIA) were run to examine the impact of the windfarm on both the people and the environment.

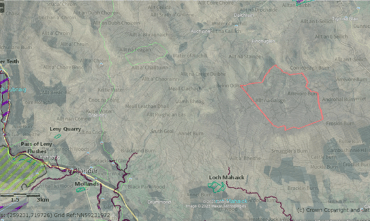


Figure 2a: aviation map, green areas indicate no flying concerns.
Figure 2b: Closest forest areas and national reserves highlighted.
Figure 2c: Highlighted areas indicate birds and bats high nesting and migration zones.
Figure 2d: Peatland map shown. Pink area illustrates peat rich land.
The social investigation included impact on people’s lives as well as taking in consideration other any other UK regulation that could hinder our license proposal, such as a low flying zone or high tourism impact.
Since the windfarm is located at a minimum distance of 8 kilometres from the nearest town, our research has shown that both noise and visual impacts on the residents will be minimal, if any at all. Furthermore, the land we are taking into consideration is neither a high tourism location nor intended for farmland use, hence the construction of the windfarm will not affect either of these sectors in a negative way. In addition, the presence of already suitable roads in the area indicates that we will not need to build a compelling volume of new infrastructure for our project, further minimising the change of the landscape. The already existing infrastructure will also help when connecting the windfarm to the national grid. In fact, there is a 270kV functioning substation in the location of Draco, just 10 kilometres away from the site. This substation will allow us to distribute our energy without limitations, while limiting our impact on the landscape when installing the connection cables. Finally, the site is listed on the aviation charts as an area with no military flying concerns and has no civil aviation aerodromes in the vicinities, as indicated form the diagrams above. Thus, the area proves to be suitable as it will not negatively impact people’s lives or businesses, nor encounter any constraints due to flying habits.
Similarly, the EIA was carried to inspect the impact of the windfarm on the environment, and if there was any environmental factor that would cause the windfarm to be unsuitable for the area. These factors and how we plan to deal with them will be discussed in more details in the EIA section of the article. In our investigation, we included vicinities to national parks or reserves and possible impact in wildlife, mainly bats and birds, any water body our turbines might affect and the composition of the soil. Once again, as shown by the diagrams, the area chosen appears to not be a concern for most of these problems: research highlighted no major water bodies or forests in the area. The distance of our windfarm to national parks, closes is more than 20 kilometres away, will also guarantee no major impact on the wildlife of the zone. Birds and bats migration routes and nesting areas were also examined, and it was found out that the windfarm would not have any negative impact on them as the site chosen is not traversed by either bats or birds. When analysing the soil of the site, we discovered that is composed of carbon rich soils and peat. This soil is highly important for both vegetation and the storage of CO2. Therefore, the soil could prove to be a problem for our selected site, and our actions to mitigate its impacts are described in the EIA section of the article.
The location was chosen as, in addition to optimal conditions for turbine design and functioning, it proves to overcome all the possible social concerns, as well as not vastly impacting the environment, with the soil composition being the only possible problem that emerged in our analysis.
Technical Summary:
Choice of Turbine
Upon evaluation of three distinct turbine types, option 2 emerges as the most fitting choice for this proposed project.
Table 1: Wind turbine generator type 2 metrics
|
Option |
Power Rating (MW) |
Hub Height (m) |
Rotor Diameter (m) |
Cost per Turbine (£) |
Cost/MW |
|
2 |
3.6 |
95 |
120 |
2,322,000 |
645,000 |
From a financial perspective, Option 2 promises the highest overall profitability. While alternative options might present a higher profit per MW, it's crucial to consider the cumulative financial impact of foundational work and ongoing maintenance. Moreover, it's noteworthy that opting for larger turbines limits the total number of turbines due to efficiency constraints, which in turn, could result in diminished profits for our project.
From a technical standpoint, the selection of option 2 has been strategically chosen to optimize our wind farm operations. The range of wind speeds in the area from 7.22-10.83m/s sat at the upper end of option 2’s power curve, as illustrated by Figure 3. Thus, option 2 produces power more effectively relative to its cost compared to the larger turbine 3, and is less prone to reaching excessive speeds that would result in a shorter life expectancy and excessive curtailment compared to option 1.

Figure 3: Power curve for Turbine 2.
WAsP Analysis
Figure 4a demonstrates the proposed site location (location 3), while Figure 4b illustrates the wind directions expected in the areas.


Figure 4a: windfarm location.
Figure 4b: prevailing winds recorded in the area.
After the decision of turbines in previous procedures, WAsP is further applicated to obtain relevant information about geometric detail resulting in the optimization of wind farms construction. There are some essential parameters that needs to be considered in our proposals such as power, percentage of wake loss and Ruggedness index (RIX).
Firstly, one of major considerate factors is the influence of a site location with a neighbouring wind farm which could be a significant effect to the proposed wind farm if the not managed properly.
The wind direction is shown in the section of WAsP’s wind atlas which relates to a western/ southwest wind direction. To maximize the energy efficiency of wind turbines, the attitude of wind turbines is ensured to be placed in the most frequent wind direction in figure.4b. The detail of wind in location 3 is analysed. It was found that the maximum speed reaches up to 10.98 m/s in the diagram of wind atlas, while the lower speeds of approximate 7.47m/s pass through the whole section with less frequent speeds of wind. This geometric detail confirms the effectiveness of the uniform wind speed distribution at the proposed site location for operation of wind farms and placements, which will gurantee stable power and energy generations.
Table 2 reveals the regularity of wind conditions at the site location, with each turbine encountering average wind speeds exceeding 8.5 m/s, thus exhibiting the effectiveness of proper turbines placement. The ruggedness index for the site is also relatively low with given desired site velocity profiles.
Table 2: Average wind speed encountered by turbines and their ruggednes index
|
Turbine site |
Ruggedness index (RIX %) |
U (m/s) |
|
WTG 1 |
6.9 |
9.55 |
|
WTG 2 |
0.4 |
8.84 |
|
WTG 3 |
3.0 |
8.79 |
|
WTG 4 |
0.2 |
9.17 |
|
WTG 5 |
0.2 |
9.15 |
|
WTG 6 |
1.5 |
8.58 |
|
WTG 7 |
3.1 |
9.41 |
|
WTG 8 |
0.2 |
8.9 |
|
WTG 9 |
6.4 |
10.6 |
|
WTG 10 |
7.4 |
10.34 |
|
WTG 11 |
1.4 |
9.12 |
|
WTG 12 |
2.2 |
8.9 |
|
WTG 13 |
1.5 |
8.83 |
|
WTG 14 |
4.5 |
9.01 |
|
WTG 15 |
0.6 |
8.77 |
|
WTG 16 |
0.8 |
8.5 |
|
WTG 17 |
1.1 |
8.87 |
|
WTG 18 |
1.0 |
8.85 |
Turbine placement
After analysing the site and selecting the appropriate turbine configuration, we carefully considered the placement of the turbines to optimise power generation and efficiency.
Turbine spacing was the first factor we examined. Given the prevailing wind direction from the west/west-southwest and the proximity of a neighbouring wind farm southwest of our site, we anticipated there would be additional wake losses for our wind farm. Turbine wakes can cause turbulence that significantly reduces power output and can even damage rotor blades due to inconsistent airflow incompatible with the turbine's aerodynamic profile.
To minimise wake losses, turbines are generally spaced 5-9 rotor diameters in the prevailing wind direction and 3-5 rotor diameters in the perpendicular wind direction. Utilizing topological maps from WAsP and Google Earth, we measured a minimum distance of 5 rotor diameters between our turbines and those of the neighbouring wind farm. We also positioned our turbines to allow turbulence generated by one turbine to dissipate before reaching the next turbine in the prevailing wind direction. However, occasionally turbines were positioned closer than recommended, in the distance perpendicular to the windspeed to maximise the number of turbines in areas with a particularly high wind speed, while not causing any safety or efficiency problems, as shown in Figure 5.


Figure 5a: Wind turbine placement within site 3 (Our wind farm is in red whilst the neighbouring wind farm is in blue).
Figure 5b: Wind turbine placement in relation to the measured wind speeds.
Given the site's geography, our priority was to position the turbines on hilltops or ridges to take advantage of increased wind speeds resulting from the compression of streamlines. However, caution was exercised to avoid areas where turbines would encounter turbulent air due to separation zones. By studying the elevation profile of the site using Google Earth, we ensured that slopes steeper than 15% were avoided to ensure construction feasibility.

To comply with noise and shadow flicker regulations, we maintained a distance of 10 times the rotor diameter (1.2km) between the turbines and any residences or schools. Fortunately, the site is located more than 3km away from any residential areas, bodies of water, or national parks, giving us confidence that the placement of our turbines within the site will not be affected by these regulations.
Figure 6: Resulting locations of windfarms within the site.
Capacity Factor and Annual Energy production
To determine the net capacity factor and energy production of wind farm, it is necessary to take various elements into account where could deteriorate the output of the turbines over a specified duration. Prior to accounting for losses, the capacity factor of the site is exceptionally high.. Presented below are the tables of losses along with a summary of the annual energy production and other vital considerations within the wind farm calculations. The outcomes of the WAsP simulations are illustrated in Table 2, Table 3 and Table 4.
Table 3: Measured output for turbine cluster and key parameters needed for the site.
|
Site, taking account of external wakes |
||||
|
Variable |
Total |
Mean |
Min |
Max |
|
Total gross AEP [GWh] |
310.958 |
17.275 |
15.947 |
19.743 |
|
Total net AEP [GWh] |
281.022 |
15.612 |
14.21 |
18.727 |
|
Proportional wake loss [%] |
9.63 |
- |
4.55 |
14.3 |
|
Capacity factor [%] |
49.5 |
- |
45 |
59.3 |
|
Site, not taking account of external wakes |
||||
|
Variable |
Total |
Mean |
Min |
Max |
|
Total gross AEP [GWh] |
310.958 |
17.275 |
15.947 |
19.743 |
|
Total net AEP [GWh] |
292.713 |
16.262 |
14.59 |
19.083 |
|
Proportional wake loss [%] |
5.87 |
- |
2.73 |
8.51 |
|
Capacity factor [%] |
51.5 |
- |
46.2 |
60.5 |
Table 4: WAsP output for turbine cluster within site, with key output parameters and external wakes
|
No of WTGs |
18 |
|
|
Rated Capacity (MW) |
3.6 |
|
|
Wind farm capacity |
64.8 |
|
|
Gross before wakes |
310.958 |
|
|
Gross After wakes |
281.022 |
|
|
Wakes |
9.6% |
|
|
Availability |
96.00% |
4.00% |
|
WTG Performance |
99.00% |
1.00% |
|
Electrical loss |
97.00% |
3.00% |
|
Environmental |
98.00% |
2.00% |
|
Curtailment |
100.00% |
0.00% |
|
Net Annual Production (GWh) |
253.89 |
£17,772,258 |
|
Capacity factor |
44.70% |
Overall, the site has achieved a net energy generation, and even with the estimated losses, a great capacity factor was realized as follows:
Energy Generation: 253.89 GWh
Capacity Factor After Losses: 0.447
Environmental impact:
Although it is true that wind power generation produces no greenhouse gas emission, it is not fair to claim that the windfarm will have only positive impacts on the environment. In fact, both the construction phase and functioning phase of the windfarm may influence many environmental factors, which if not considered appropriately may outweigh the benefits received by the windfarm.
Therefore, running an Environmental Impact Assessment (EIA) when designing the project is one of the most crucial requisites to ascertain the windfarm will not greatly impact the environment, and come up with mitigation measures in case the windfarm does impact one of these factors in an extreme way.
During the EIA, the windfarm location was scrutinised to determine its distance from natural parks and reserves and the possible negative impact it would have on the wildlife, the effect of the wind turbines on any water bodies in the area, the effect of the windfarm on bats and birds’ migrations and nesting, and finally the effects it would have on the landscape and soil, which, as already mentioned, was one of the biggest problems for our site.
As illustrated previously, there are no forests or national parks in this area, hence our windfarm will not affect these branches of the environment. Similarly, the defra magic map highlighted that there is no major water body to avoid when building the turbines, thus not proving to be a problem for our site. However, it is worth noticing that during the high precipitation period, some minor water bodies may appear. These little streams and lakes may sometimes be an important source of fresh water. Therefore, more investigations need to be run on the site to explore this specific phenomenon. However, this can be mitigated in the construction phase by the implementation of an appropriate drainage system which will allow the fresh water to collect uncontaminated as expected. Therefore, at DNOC we will move part of our budget to accommodate this drainage system should fresh water contamination prove to be a problem.
A different concern arose when looking at the composition of the soil. In fact, much of Scotland, and the selected area, is comprised of peat, which is a very important resource for the environment. Peatland is essential for biodiversity, as many plants rely on its nutrients to survive. Peat-rich land is also essential for improved water quality, as it absorbs some of its pollutants, and to reduce flooding by regulating water run-off on the surface. More importantly, and more significant to our design, peatland acts as a major carbon storage unit, helping to absorb CO2 and other pollutants and combating climate change. Thus, as DNOC’s goal is to provide clean energy, destroying the peatland would not abide with the ethical norms of the project.
To overcome this problem, DNOC is committed to use a large part of their budget to appropriately deal with the peatland. Firstly, 2 million pounds will be allocated for the safe removal and transportation of the CO2 and peat of the area. With this method, it will be ensured that there are no additional CO2 emissions and that the peatland can be safely used, for examples in farmland activities. Secondly, throughout the lifecycle of the windfarm, DNOC will donate part of its profits to associations that plan to restore the damaged peatland in Scotland, currently more than 80%. DNOC promises to donate a sum large enough to restore an area as big as the area of our windfarms. Through these donations, 12 acres of peatland will be restored in Scotland for a total of an additional 2-million-pounds worth of donations.
Therefore, although it is impossible to guarantee a zero impact of the environment from the windfarm, it was illustrated through the EIA how most environmental factors are not greatly affected by the construction and operation of the wind turbines. Thanks to the EIA it was also possible to evidence the areas that will be affected most, allowing for possible mitigation measures to be planned accordingly and reduce the overall environmental impact of the project.
Community Consultation and Social Impact:
A Project does not just affect the biophysical environment & is likely to impact as well as benefit the inhabitants of the concerned locality. Considering that the EIA is a process to assess the impacts & benefits of a development, in a transparent way, the involvement of the community is an important aspect of stakeholder engagement. DNOC is committed to collaborate & enhance the relationships with the Stirling Community by apprising them of all the pertinent & relevant aspects of the Project. Hence, we have proposed to collaborate with the community in the following manner:
|
Public Participation Goal |
Commitment |
Actualization Techniques |
|
INFORM To provide the public with objective information about the Wind Farm & updating them with all Project developments. |
We will keep the public informed about pertinent aspects of the Project. |
|
|
CONSULT To gauge the preliminary rection of the public to the Project & to understand any concerns they may have. |
We will keep the public apprised of the Project & to acknowledge with due consideration, any objections they may have. |
|
|
INVOLVE To work with the public through the Project development to ensure public concerns & aspirations & thoroughly understood & addressed. |
We will provide feedback how the public opinion was reflected in decision making. |
|
|
COLLABORATE To partner with the community in order to consider alternative solutions involving them in every aspect of decision making. |
We will pay heed to the community’s advice collaborate with them to formulate solutions considering their recommendations to the maximum extent. |
|
Due consideration to the Environmental & Social Impacts of the Proposed Wind Farm Project was given right from the process of site selection. We chose a site which was considerably remote & away from the proximity of residences in order to be pro-active in mitigating any possible effects. Based on our preliminary surveys, noise increase due to the wind farm is a main concern for most inhabitants of a community. We have located our farm at least 8 kilometres away from the nearest town, to protect the residents from any noise the WTGs may emit. Furthermore, our engineers have ensured a strategic placement for all turbines in a way to minimise the distances any noise can travel.
Our studies have also highlighted complaints about the shadow flicker effect of the wind turbines. However, the shadow flicker is mostly perceived within 1.2 kilometres from the turbines, and we ensured during site selection that no residence was within 3.5 kilometres of our turbines. Thus, the flickering effect will not affect anyone except in very rare cases for which we have kept the option of shutting the turbine for the specific duration to prevent any nuisance to the residents affected.
Maintenance, Decommissioning, and Repowering:
Annual inspections conducted in the summer season and prompt repairs will form the cornerstone of our maintenance strategy. By implementing advanced radar systems, monitoring tools, and data analysis, our operations team will possess the capability to detect unforeseen incidents promptly and minimize their impact.
The cost of decommissioning has been thoroughly considered in our financial analysis. However, given the Scottish government's supportive stance towards renewable energy, it provides strong evidence to suggest that life extension and repowering options are highly feasible. With diligent maintenance and regular inspections, our construction team will be able to seamlessly and easily extend the wind turbine's lifespan, creating opportunities for lifetime extension or repowering beyond the initial 25-year duration, if needed.
Financial Analysis:
This projected wind farm, slated for a preliminary expenditure of $69 million, which includes a part of the budget (5% of the total) for any unexpected extra costs, details showed in Table 5. The pre-implementation budget has been successfully secured through a loan of $70 million from a banking institution, agreed upon a 3% interest rate with a repayment period spanning 10 years.
Table 5: Cost in development Stage
|
Construction Cost |
|||
| CapEx During Construction | |||
|
Turbines |
£ |
41,796,000 |
|
|
Additional WTC costs |
10,449,000 |
||
|
Grid Connection |
7,500,000 |
||
|
Environmental impact costs |
2,105,892 |
||
|
Development cost & fees |
4,179,600 |
||
|
Total Cost pre-financing |
|
66,030,492 |
|
|
Contingency & financing Cost |
3,301,525 |
||
|
Total Construction cost |
£ |
69,332,017 |
On an annual basis, the wind farm is projected to generate 253.89 GWh of power, leading to a revenue stream of $17 million, grounded on the prevailing electricity rates. The point of equilibrium, where costs match the income, is anticipated to be reached by the end of the 8th year. The net revenue for the project, over a total operation span of 25 years, is estimated at $196 million.
Table 6:Estimate annual profit through 25 years
|
|
|
Year 1-10 |
Year 11 - 12 |
After Year 13 |
|
|
Revenue |
£ |
17,772,258 |
17,772,258 |
17,772,258 |
|
|
Costs |
|||||
|
Rent |
(1,072,335) |
(1,072,335) |
(1,429,781) |
||
|
Maintenance |
(4,179,600) |
(4,179,600) |
(4,179,600) |
||
|
Operating Expense |
|||||
|
Environmental impact costs |
(84,637) |
(84,637) |
(84,637) |
||
|
Community Cost |
(360,000) |
(360,000) |
(360,000) |
||
|
Financial income and expenses |
|||||
|
Interest Expense |
(2,407,415) |
- |
- |
||
|
Yearly profit (loss) for the period |
£ |
9,668,270 |
12,075,685 |
11,718,239 |
Research conducted on the project indicates that there are currently no applicable subsidies, and awareness of the forthcoming AF5 for Contract for Difference has been noted. After a comprehensive analysis, the team remains optimistic about the electricity price. Given the recurring energy crisis and the inflationary economic environment, the inherent risk associated with the contract difference, which would necessitate payments to the government, is considerably high.
In terms of potential investment opportunities, the option to resell our wind farm for profit should be evaluated. Given the transaction value of the nearby Braes of Doune Wind Farm, which was recently sold for £51.4 million, it is evident that our site could prove to be a viable and lucrative investment opportunity.
Therefore, given the interest in the market and the considerable profit expected throughout the 25 year life cycle of the windfarm, DNOC believes this project is a suitable plan to invest in in the future, both from the financial point of view and the design point of view, as illustrated in the previous sections of the article.
References:
- Scotland environmental map
https://map.environment.gov.scot (Access on 01/06/23) - UK aviation charts https://webarchive.nationalarchives.gov.uk
- Carbon and peatland 2016 map https://map.environment.gov.scot/Soil_maps (Access on 01/06/23)
- MAGIC Map
https://magic.defra.gov.uk/MagicMap.aspx - Braes of Duneinvestment article:
Reid, S. (2021, February 24). Surge of interest in Scottish wind farms as three major deals sealed. The Scotsman https://www.scotsman.com/business/ (Access on 01/06/23)