Equate Wind Farm Project 2021, Team Adapt.
Follow article Dave from DesignSpark
How do you feel about this article? Help us to provide better content for you.
Dave from DesignSpark
Thank you! Your feedback has been received.
Dave from DesignSpark
There was a problem submitting your feedback, please try again later.
Dave from DesignSpark
What do you think of this article?
Technical Design
In the project, three types of wind turbines were provided for selection with 75 metres, 95 metres, and 110 metres high. Determining what types of wind turbines used for the project would be essential for the project because they impact the output energy of the wind farm, and the final cost of the project. The table is shown below presenting the basic information about each wind turbine.
| Turbine | Power Rating (MW) | Hub Height (m) | Rotor Diameter (m) | Cost per turbine |
| 1 | 2.5 | 85 | 100 | £1,290,000 |
| 2 | 3.6 | 95 | 120 | £2,322,000 |
| 3 | 5.6 | 110 | 150 | £4,334,400 |
First, we considered the power rating of each wind turbine. We calculated how many wind turbines were needed, and their corresponding costs to obtain 100 MW. The result of the calculation is shown below:
|
Turbine |
Number of Turbines |
Cost of installation (£) |
Maintenance Fees |
|
1 |
41 |
52.89 million |
£5.289 million |
|
2 |
28 |
65 million |
£6.5 million |
|
3 |
18 |
78 million |
£7.8 million |
In conclusion from this table, turbine 1 would have the highest wake losses, and turbine 2 and 3 would have similar energy output. We selected turbine 2 for the project.
Location selection
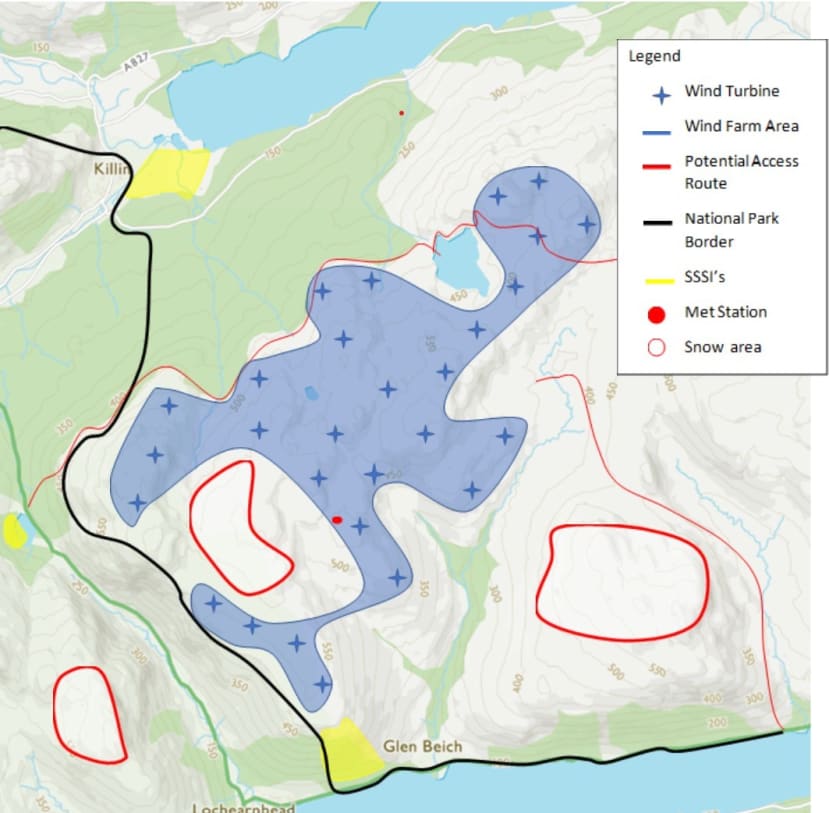
Following the instruction of a location feasibility test, we placed our turbines. Physical constraints are obstacles that we would like to avoid, like woodlands, hedges, residential buildings, and landscape features that will impact the location of wind turbines. Placing wind turbines near these obstacles will increase the installation time of wind turbines, expand the budget, and open the company to a possible lawsuit so they were avoided as far as possible.
The graph on the right side is the original contour map of location six. The map on the left side is with physical constraints. Red, green, blue, and purple circles present the residential area, ancient woodlands, lakes, and snow area. As well as the physical constraints test, the planning sensitivity assessment is also conducted, and this assessment aims to quantify the planning consent risks of ecology, landscape, and cultural heritage.
Once finished with the operational feasibility assessment, we simulated the wind farm using WaSP software to get energy output. The map shows the location of 28 wind turbines. They are five rotors away from each other and close to the met station and roads.
Community Engagement Plan
The most pressing social impact would be any adverse health conditions. The World Health Organisation stated that the main health impact caused by wind farms is an annoyance. To minimise this annoyance amongst the community we have prepared a social engagement plan that we will follow to promote positive engagement within the community and support the locals’ needs.
- Informing communities of the plan for the wind farm.
- Educate the community about the reason for building the wind farm.
- Focus groups for different age groups to understand different concerns.
- Appoint a community liaison coordinator.
- Share plans for community benefit payments.
- Fuel Poverty Fund Allocation.
- Share our environmental findings.
- Highlight new job prospects to residents.
Finance
We are applying for a loan of £86,542,000 with an interest rate of 3% for a wind farm to be based in Stirling. There will be 28 turbines at a cost of £2,322,000 each, giving a total of £65,016,000. A total cost breakdown is given in the table below:
| Cost | |
| 28 x Type 2 Turbines | £65,016,000 |
| Connection to the National Grid | £5,250,000 |
| Roads and Foundations | £16,254,000 |
| Rent whilst Building | £6,000 |
| Rent during Windmast Survey | £6,000 |
| Environmental Impact Assessment | £10,000 |
| Total | £86,542,000 |
This table represents the total initial infrastructure costs required to begin construction and to construct the wind farm. The usual value for an environmental impact assessment is around £1,000 to £10,000, therefore, we are estimating that it will cost £10,000 to ensure that different types of surveys can be carried out. Other costs that will be considered over the lifetime of the project include community benefit payments (at £192,000 per annum), maintenance costs of the turbines (at £6,502,000 per annum), and land rent. This gives the gross profit over twenty-five years to be £262,966,000. In addition to this, some funds will be allocated for the decommissioning of the turbines in year twenty-five. If we are unable to sell, recycle, or extend the lifetime of the turbines, it will cost around £375,600 to decommission each turbine. Therefore, the total decommissioning cost is £10,517,000. As a socially responsible company, we will also endeavour to contribute to the environment. If the site must be fully decommissioned and cannot be repowered, then the cost of restoring the land to its original state is roughly £1,000,000. The total maximum decommissioning cost is £11,517,000.
Therefore, the minimum yearly profit can be seen from the graph below:

Review of Site designations and protected areas
Reviewing the location revealed that there are 2 SSSI’s within 5km of the site. Upon reviewing the classifications it was discovered that the proposed wind farm would not interfere or cause detriment to these sites. The area in which the site is located is home to wildlife such as birds of prey alongside red deer and hares. However, there is no designated Special Protected Area nearby and therefore a full bird study should be conducted before construction to affirm the site’s suitability. There are also no Natura 2000 sites near this location.
A study of the site soil was conducted and it was found that the site does feature some Class 1 and 2 peatland. This area should be avoided as far as is reasonably practicable and usage minimized to reduce CO2 emissions.
The proposed wind farm does come close to the border of the Loch Lomond and Trossachs national park. To address the concerns raised by the local community it is important not to impact the tourist attractions. There is a woodland trail on the southwest side of the proposed site, the Glenogle Trail, however, this will be unaffected during construction and operation.
During our assessment we tried to access the 2015 Stirling Landscape wind study, however unfortunately the link hosting this document has been unavailable since January 2021.
CO2 emissions calculations
From our location study, we knew our site was situated on Peatland. Initially, we intended to use the Scottish Government windfarm on peatland calculator to calculate the carbon emissions over the lifetime of the project. This calculator requires the input of a large number of variables for a prospective wind farm in order to calculate the carbon emissions of such a site. It quickly becomes apparent to us that in order to use the tool we have to make a large number of assumptions and thus the effort would yield an unreliable result.
Instead, we conducted a literature review in order to find data and trends obtained from real-world sources in order to guide our calculations. A study by R Camilla Thomson, Gareth P Harrison at the University of Edinburgh on behalf of ClimateXChange collated data from many different studies to estimate the CO2 eq emissions from various onshore windfarms. From this it was clear that wind farms built on peatland released significantly more CO2 eq than those built on mineral soil. In particular a study from the University of Aberdeen ‘Calculating carbon budgets of wind farms on Scottish peatlands’ showed the correlation of CO2 eq emissions with the capacity factor for wind farms built on peatland. This study was particularly useful as it follows the same methodology of the Scottish Government calculator for peatland wind turbines, but with much more accurate results than we could estimate.

This was sourced from 'Life cycle costs and carbon emissions of wind power. ClimateXChange 2015'.
Using this information and the data acquired from our analysis on WaSP we calculated the CO2 reduction obtained by building the wind farm to generate the power as opposed to burning fossil fuels. We extrapolated to find the CO2 eq for a capacity factor of 37% which was approximately 130 gCO2eq/KWh. It is worth noting that this number includes a contributing from deforesting the land, which is not required in our case and is hence an overestimate. To calculate the fossil fuel equivalent, a value of 400 tonnes of CO2 eq /GWh of energy was obtained from the 2020 UK Government ONS report.
Total Fossil Fuel Emissions=334.66GWh∙400tCO2 eqGWh∙30 Years=4.016Mt CO2eq Total Fossil Fuel Emissions=334.66GWh∙400tCO2 eqGWh∙30 Years=4.016Mt CO2eq
Total Wind Farm Emissions=334.66GWh∙130gCO2eqkWh∙30 Years=1.3043 Mt CO2eqTotal Wind Farm Emissions=334.66GWh∙130gCO2eqkWh∙30 Years=1.3043 Mt CO2eq
Reduction in Emissions=(1−1.3043 Mt CO2eq 4.016 Mt CO2eq)∗100=67% ReductionReduction in Emissions=1−1.3043 Mt CO2eq 4.016 Mt CO2eq∗100=67% Reduction
Using the infrastructure to operation emission percentages from the studies, the emissions over time were plotted to find the ‘break-even point'. It was found that this would occur after approximately 11 years.
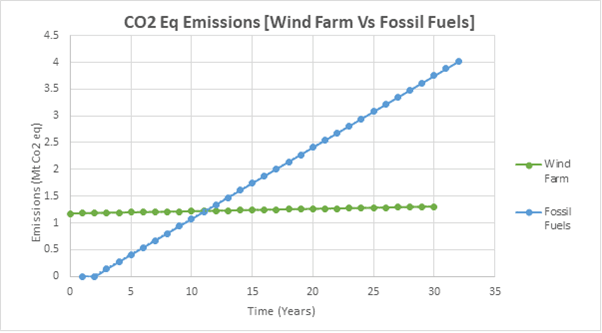
Thus, after approximately 11 years of operation, the wind farm would produce less CO2 emissions than the fossil fuel equivalent.
Improving the Local Economy
In 2011 onshore wind supported 8,600 jobs and was worth £548 million to the UK economy. A total of 1,100 jobs were created at a local authority level. This would be a positive selling point to locals to get them on board with the project. The project would require some infrastructure development in the area and so this, in turn, could create more jobs and increase accessibility to the area. This increased accessibility could lead to an increase in tourism in the area which again could boost the local economy.
Unforeseen Circumstances
In order to find out what risks we were taking by proposing this wind farm, we carried out some small scale risk assessments to see what risks were the most severe.
Economic
|
Risk |
Likelihood |
Consequence |
Total /100 |
Mitigation |
Residual Risk |
|
Licence Application Rejected |
6 |
10 |
60 |
Respecting all environmental and social measures. |
20 |
|
Drop-in Electricity Prices |
7 |
8 |
56 |
Long-term power purchase agreement. |
18 |
|
Construction Delays |
8 |
7 |
56 |
Outsourcing construction. |
20 |
|
High Wind Speeds |
7 |
7 |
49 |
Careful planning of turbine locations. |
14 |
Environmental
|
Risk |
Likelihood |
Consequence |
Total /100 |
Mitigation |
Residual Risk |
|
Peat Bog Degradation |
8 |
9 |
72 |
Utilising peat bog restoration measures. |
21 |
|
Visual Impact |
10 |
6 |
60 |
Careful wind turbine and access road placement. |
20 |
|
Harm to Wildlife |
4 |
8 |
32 |
Perform adequate wildlife surveys for birds and nearby waterways. |
16 |
|
Water Contamination |
2 |
8 |
16 |
Ensure correct maintenance measures are in place. |
8 |
The route shown in the following image highlights the safest way to carry equipment and machinery to the site.

Planning for the future
The scale and principle of wind energy are changing. Scotland is home to one of the first offshore floating wind farms that are home to turbines bigger than Big Ben and the Statue of Liberty, smaller scale turbines are also being developed that can be used on a residential scale. Also, the technology used to harness the energy from turbines is changing and bladeless turbines are being developed which would reduce the risk of parts breaking, no oil consumption, modular design so can easily be installed and removed improving the overall life-cycle of wind farms.