The Decibel – What’s it for?
Follow article
 Dave from DesignSpark
How do you feel about this article? Help us to provide better content for you.
Dave from DesignSpark
Thank you! Your feedback has been received.
Dave from DesignSpark
There was a problem submitting your feedback, please try again later.
Dave from DesignSpark
What do you think of this article?

A NASA Tracking and Data Relay Satellite (TDRS). Design engineers will have calculated its Link Budget making extensive use of the decibel. Image credit: NASA
The decibel (dB): probably the most misused and misunderstood unit of measurement in electronics. At first glance, it might seem that engineers use the system of decibel units to make their craft even more impenetrable to mere mortals than it really is. Defined in the 19th century to quantify signal power loss in long telegraph lines, its usage has widened, encompassing both gain and loss calculations in all areas of electronic communication – and beyond.
Relative power calculation: gains and losses
For example, wireless communications systems are designed around a lot of ‘black boxes’ each with signal power going in (PIN), and signal power coming out (POUT) after some intervening processing. By representing power levels and gains/losses in a logarithmic (decibel) format, multiplication is converted into addition – a whole lot easier. Note that in the following discussion, the units of Power (P), Voltage (V) and Current (I) are WRMS, VRMS and ARMS respectively.
If POUT is larger than PIN then the box, for example an amplifier, has a Gain. If the other way round, as in the case of a filter, then it causes a Loss. The formula for converting Power Gain (or Loss) expressed as a simple ratio, to dB format is:
GdB = 10log10(POUT/PIN) dB [1]
GdB is a positive number if POUT > PIN (Gain) or a negative number if POUT < PIN (Loss)
Some examples:
If G = 1 then GdB = 0 dB – No Gain or Loss
If G = 5 then GdB = +7 dB – Positive Gain
If G = 0.5 then GdB = -3 dB – Loss (Negative Gain)
The last example is especially significant when specifying the bandwidth of an electronic component such as an amplifier. Datasheets normally refer to the bandwidth, or frequency response, of a device between the ‘half-power’ or ‘3dB points’ on a graph of output power against frequency.
Absolute power
Absolute power levels with units of Watts or milliWatts can be converted to a dB format. Equation [1] is used again, but with the PIN value replaced by a ‘reference value’ of 1 W if POUT is measured in Watts, or 1 mW if measured in milliWatts. This yields power values in units dBW and dBm respectively. Hence:
PdBm = 10log10(P/1) = 10log10(P) dBm – where P is in milliWatts [2]
PdBW = 10log10(P/1) = 10log10(P) dBW –where P is in Watts [3]
Some examples:
If P = 1 mW then PdBm = 0 dBm – P = PREF
If P = 5 mW then PdBm = +7 dBm – P > PREF
If P = 0.5 mW then PdBm = -3 dBm – P < PREF
In order to make the point of these calculations clearer, let’s look at a simple system (Fig.1).
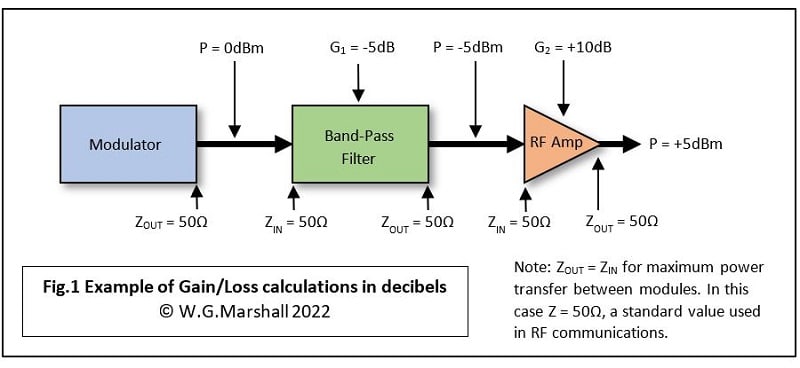
This is a block diagram of part of a radio frequency (RF) transmitter. Each functional block or module has output (source) and input (load) impedances, ZOUT and ZIN, all with the same value of 50Ω. This impedance matching has two useful consequences with high-frequency circuits:
- Maximum Power Transfer between modules is achieved. Note this is not the same as maximum efficiency.
- Minimal signal reflection, back and forth along the connecting link between source and load. Such reflections waste power and may cause circuit damage.
Making all link impedances the same also has a beneficial effect when attempting to measure the actual power output of a device.
Taking measurements
So, you’ve constructed your system using ‘50ohm’ modules and want to measure the actual power levels at every stage.
P = VI watts where P = Power, V = Load voltage, I = Load current [4]
Measuring voltage is easy with a high-impedance meter or oscilloscope, but current? That’s not so easy because it means inserting the measuring instrument into the link between two modules and thus affecting the signal itself. What to do? Well, using good old Ohm’s Law:
I = V/R where R = resistance in ohms. Substituting for I in equation [4] gives:
P = V2/R watts Note that for high frequencies, reactance is significant, so R -> Z. [5]
Great! That means if you know the value of R, you can calculate power P just by taking a voltage measurement. If R is constant for all sources and loads then equation [1] becomes:
GdB = 10log10(V2OUT/V2IN) dB – where the Rs, being equal, have cancelled out.
Finally, taking the ‘square’ out of the log makes it a multiply and gives:
GdB = 20log10(VOUT/VIN) dB – where GdB is still a Power Gain. [6]
For the example in Fig.1, we get the output voltage of the modulator from design calculation, simulation or direct measurement and find it to be about 0.223VRMS. Making V = 0.223 and R = 50 in equation [5] gives us P = 0.001W or 1mW.
Working in units of dBm
Plug P = 1 into equation [2] and you get PdBm = 0 dBm. Now you can see from Fig.1 how easy it is to work out the power levels at each stage providing that gains/losses have the units of dBs.
Working in units of dBW
In high-power systems, it may be sensible to work in units of dBW. But let’s see what happens when P = 0.001W is used in equation [3]. The result is PdBW = -30 dBW. It’s -30 because 1mW is 1000 times smaller than the reference 1W.
Finally
In the days before pocket calculators, the use of ‘logs’ as a means of turning multiplication of two numbers into an easier and quicker addition was a standard way of working. The log10 equivalents of the two numbers were looked-up in a book containing ‘log tables’. The two log numbers were then added and the result converted back to ‘normal’ by looking it up in ‘anti-log’ tables. Now of course these functions are available as buttons on any scientific calculator. For instance, on the Windows scientific calculator app, log provides log10 and 10x does anti-log.
Many applications don’t convert results back into a linear format because the logarithmic output more closely matches the response of ‘natural’ systems. The most obvious example is ‘loudness’ of sound as perceived by the human ear versus acoustic power. A logarithmic format is also very useful when displaying parameters with a very wide dynamic range. The ratio of the smallest sound detected by the ear to the loudest before causing damage is 1012! A log scale makes a graph much more manageable.
If you're stuck for something to do, follow my posts on Twitter. I link to interesting articles on new electronics and related technologies, retweeting posts I spot about robots, space exploration and other issues. To see my back catalogue of recent DesignSpark blog posts type “billsblog” into the Search box above.