Air quality monitoring in a community workshop
Follow article
 Dave from DesignSpark
How do you feel about this article? Help us to provide better content for you.
Dave from DesignSpark
Thank you! Your feedback has been received.
Dave from DesignSpark
There was a problem submitting your feedback, please try again later.
Dave from DesignSpark
What do you think of this article?
Introduction
I am a co-founder and member of a small hackspace / makerspace / community workshop based in West Berkshire. We have been established for 6 years now. The workshop has the usual equipment such as 3D printers, laser cutters, electronics benches and recently a large CNC Router. With this, there is the potential to increase the amount of dust in the air. Depending on the materials being cut and the effectiveness of dust and fume extraction, there may be an increased risk to health. With this being a community space, some members may be more at risk than others.
Some equipment has its own rooms, such as the 3D printers and electronics areas. The main workshop is home to the laser cutter, CNC router, lathe, drill press, bandsaw, workbenches and other hand tools. The only ventilation in the room is a rear fire door and the door leading to the entrance hall.
My project is to use the ESDK to monitor conditions within the main workshop to detect increases in particulate matter when using the CNC router, VOC levels when the laser cutter is running and general CO2 levels when the space is being occupied. The indicator gives a Red/Amber/Green visual indication of the air quality based on the readings from the ESDK.
The ESDK is mounted as part of a larger indicator that is to be described fully later. The data is available for other hackspace members to process and visualise as well as integrate into other monitoring and control systems within the workshop.
Problem
With a community workshop, there are no barriers to membership with all ages, genders, races and abilities welcome to join. The workshop aims to provide a safe, clean and healthy space for the members, their families and visitors to use. Due to the small size of the workshop, any woodwork activity such as sanding is expected to be done outdoors in the yard as this creates a lot of dust, even with dust extraction connected to the sander. With the installation of a CNC Router, this opened up new possibilities for creative projects as well as a new source of fine dust.
The type of dust created from the CNC router depends on the material being machined. One common material is Medium Density Fibreboard (MDF) which is comprised of mostly softwood, some hardwood, and a binder. One common binder is urea-formaldehyde. This is potentially a cancer-causing substance. The dust created is very fine and particles containing formaldehyde can be drawn deep into the lungs of anyone exposed to this.
MDF is one of the materials that is frequently cut, other woods may produce harmful dust that can be an irritant to members that have conditions such as asthma.
Dust and fume extraction systems are in place but there is no indication of their effectiveness. The vacuum unit used in the dust extraction has a filter on it that may still let the smallest particles out into the workshop. The laser cutter fume extraction vents to outside the building via an existing flue in the roof, however, some fumes may not be fully drawn out from the laser cutter bed. Having a monitor close by would help identify if there is a problem here.

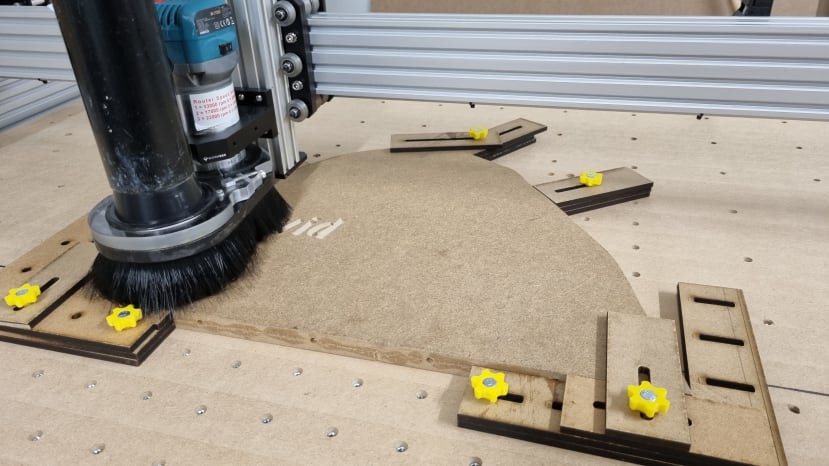
CNC Dust extraction

Dust and chip collection.
Solution
ESDK
The solution to monitoring the air quality is to use the DesignSpark Environmental Sensor Development Kit (ESDK). This measures, via a range of plug-in sensors the temperature, humidity, volatile organic compounds, carbon dioxide and particulate matter. Further sensors may be developed in the future for measuring, for example, light levels, sound levels or specific gasses.
The ESDK is based on a Raspberry Pi 3, a custom-made TFT LCD display with touchscreen, a PMOD adaptor and several plug-in sensor modules. The main ESDK unit includes a GPS receiver module but the antenna was not included with the beta kit and has not been utilised in this project. If a mobile project was being developed, then the GPS could be used for tagging readings with the GPS location. The included sensor modules are:
- Temperature, Humidity, VOC
- Particulate matter, PM1.0, PM2.5, PM4.0 and PM10
- CO2
The ESDK comes as a kit and assembly is required. This is all documented on the DesingSpark website. Once the ESDK was configured, the data became visible on the dashboard. Over time the charts became populated as more readings were recorded.
The ESDK has an MQTT broker built-in, and this can be used by external applications to access the real-time data. For a quick test, using a command-line MQTT client such as mosquito_sub will enable the data to be seen when it is published. The MQTT message data is in JSON format and can be parsed to extract the data values.
For example:
% mosquitto_sub -h airquality.local -v -t 'airquality/#'
airquality/RPI00000000cbb7e446 {"hardwareId": "RPI00000000cbb7e446", "thv": {"vocIndex": 22, "temperature": 23.4, "humidity": 38.0, "sensor": "THV0.2"}, "pm": {"sensor": "PM20.2", "pm1.0": 1, "pm2.5": 1, "pm4.0": 1, "pm10": 1}, "geohash": "gcph7q2v658v", "co2": {"sensor": "CO20.2", "co2": 685}}
Indicator
Having the ESDK with its display is ok, however, you need to be close to it to see the display and identify if there is a problem developing. Having a large light-up indicator with a simple Red, Amber, Green light to indicate the general condition will give members a quick and easy indication. The colours are based on thresholds for different sensor values.
The indicator is in the shape of a cloud and is laser cut from two pieces of acrylic separated by 10mm spacers. The back is a solid colour, and the front panel is opaque white. The ESDK is mounted to the front via the included DIN rail.

The RGB LED strip being used by the display was not being driven by the PI on the ESDK, although it could have been. It was being driven from a Pycom Lopy4 device as this was a good way to demonstrate a method for subscribing to the MQTT data and providing a visual output based on the values received. The basic application on the Pycom Lopy4 is written in MicroPython. It uses the hackspace WiFi to connect to the ESDK where it subscribes to the MQTT topic. The JSON data is parsed and values checked against a number of thresholds. If any of the defined thresholds are exceeded then the colour of the LEDs is changed to either green, amber or red to provide the basic visual indication of the air quality.
Dashboard
The DesignSpark dashboard is available to the beta testers and provides a cloud-hosted instance of the widely used Grafana software. This provides several gauge displays showing the current value of the sensors and a series of historic charts to track the readings for each sensor.

This shows the DesignSpark dashboard, showing the current readings and historical readings for temperature and humidity.
Testing and Results
The ESDK was left to run for a few weeks to collect data. During this time the workshop members went about their usual activities using the facilities provided. There were weekly open evenings with prospective new members visiting.
Temperature and Humidity
As expected, the temperature and humidity rose and fall throughout each day in a non-eventful manner. Having an additional data feed from a temperature probe outside of the building would have been useful for comparison.
VOC
There were changes with a maximum value of 265, however, there is no data on what activities were being done at the time to give a high reading.
CO2
The carbon dioxide data can be used as an indication that the workshop was being occupied. Increased levels were seen during the weekly open evenings and when multiple members were working in the workshop. Opening the rear door allowed the CO2 levels to become lower due to the increased ventilation.

Temperature, humidity, VOC and CO2 readings over a 24hr period.
Particulate matter
I went in on several occasions specifically to use the CNC-Router to test the particulate sensors and to see if it would detect an increase in particles. During these times, there was an increase, but not as great as I expected. I'm suspecting that the filtration on the vacuum cleaner used in the dust extraction was effective at keeping many of the particles out of the workshop.
It was, however, noted that on several occasions when the workshop was being occupied but the CNC-router was not being used there was a noticeable increase in particles being detected. This put down to dust on the concrete floor being disturbed.
It was also noted that the 4 readings, pm1.0, pm2.5, pm4.0 and pm10 were all the same value most of the time.

PM2.5 and PM10 values while using CNC Router to cut MDF.
Community involvement
Evening talk and demonstration
An evening talk and workshop was setup where interested members came along to see details of the project, how the ESDK works, the cloud indicator and dashboard. There was a discussion on how the project can be used to improve the workshop conditions and general air quality issues.
Opened to other members' projects and integrations
The data is available for others to access via the MQTT broker on the ESDK. A number of project ideas have been discussed including setting up a local Grafana instance to allow all members to see the historic data. Integration within a HomeAssistant setup
Conclusions
Overall the DesignSpak ESDK is a good piece of kit with potential for expansion. Developing applications based on the ESDK was not explored with this project and improvements to the provided software are likely to come in time as more people provide updates.
Using the cloud-shaped indicator provided an easy-to-see general indication of the air quality within the workshop with those waning further information using the ESDK display to confirm which values are likely to have triggered a colour change. Being able to integrate with other systems is great, using MQTT provides an easy way for other systems to access the data without having to provide direct login access to the ESDK.
More testing and evaluation are being done to determine the effectiveness of the data being read. I have already seen a second site that would likely benefit from a similar system in the future.