A Sneak Preview Of Upcoming New Air Quality Application Features
Follow article
 Dave from DesignSpark
How do you feel about this article? Help us to provide better content for you.
Dave from DesignSpark
Thank you! Your feedback has been received.
Dave from DesignSpark
There was a problem submitting your feedback, please try again later.
Dave from DesignSpark
What do you think of this article?

The ESDK Air Quality app gets a new desktop and mobile-friendly user interface, plus new software features.
In this article, we’ll take a look at the new desktop and mobile user interface for the Air Quality application, and some of the new features within the software itself.
New User Interface!

During the development of the Air Quality application UI, a number of on-screen elements had to be fixed to a certain size due to the small window that the web browser runs in. This meant that the UI, when scaled up to a full desktop or mobile device viewport, didn’t work well.
To address this we built a new UI specifically aimed with desktop and mobile use cases in mind. Keeping with the same Bootstrap HTML and CSS themes as the existing user interface eases the legwork necessary to create a full UI, and means that we can reuse code between the two.

The full UI features a number of “cards” that contain each metric, and a small graph of the metric history above — much the same as the on-device UI. When displayed on a smaller device the cards all stack one above the other whilst retaining their readability, and the charts become responsive to scale to a smaller display.

The flexibility of the device width breakpoints that Bootstrap provides, enables the top menu bar to collapse into a “hamburger menu” when viewed on a device with a smaller screen width than an average desktop computer; Bootstrap is designed to be “mobile-first”, which is a web design paradigm that follows the shift into mobile phones becoming the predominant device used for browsing the web.

As with the device UI, debugging information is tucked away in another tab that can be accessed from the top menu bar. All the debug info is broken down into cards that logically group information, such as GPS mode, satellite count and location provided to the AQ application. Other debugging information includes data such as free space on the /aq partition that is used for keeping CSV logs, application and DesignSpark.ESDK module versions, the hardware ID, and throttle status of the Raspberry Pi.
Device UI Updates
As the on-device dashboard had not seen any attention since GitHub contributor, Mike, added swish charts, we decided to implement some new features.
GPS Status Indicator
One feature that we felt was sorely missing was GPS status indication which would eliminate the need to go into the debugging screens just to find out if the GPS was enabled, and if a solid location lock had been achieved.
As GPS mode and satellite count were already published on the WebSocket interface, it was trivial to add some Javascript to toggle the visibility of an icon. We made use of the “crosshairs” icons from Material Design Icons to represent three GPS states of disabled, enabled, and GPS locked.
if(debugData.hasOwnProperty('gpsStatus')) {
    gpsData = debugData['gpsStatus'];
    if(gpsData.hasOwnProperty('mode') && gpsData.hasOwnProperty('satellitesUsed')) {
        // Show appropriate GPS status icons
        if(gpsData['mode'] == 0) {
            $('#gpsLockedIcon').hide();
            $('#gpsNoSatsIcon').show();
        }
        if(gpsData['mode'] >= 2) {
            $('#gpsNoSatsIcon').hide();
            $('#gpsLockedIcon').show();
        }

        $("#gpsMode").html(gpsData['mode'] + ',' + gpsData['satellitesUsed']);
    }
}
The above code controls the visibility of the two SVG icons based upon the GPS mode and satellites present and hides both of the icons if GPS location is disabled.
CSV Logging Indicator
Another enhancement we wanted was an indicator that showed an at-a-glance view of whether CSV logging was enabled and running.

Again, as the CSV logging status was already published to the WebSocket, adding a blinking indicator was trivial. Another Material Design Icons icon was utilised with a simple CSS animation to make the icon blink, and then the same code that controls the GPS status indicator was repurposed by changing the selector ID to match the recording icon name.
Support For New Sensors

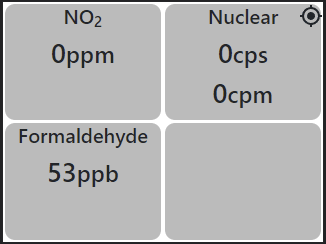
The dashboard has been extended to include three new metric tiles for the three new ESDK sensors: formaldehyde, NO2 and nuclear radiation — details of the new sensors are covered in their own articles. The metric tiles are implemented as a second screen that can be accessed by using the left and right arrow keys on a keyboard, which usually aren’t found on the ESDK hardware. We’ll talk about how we implemented left and right keys on the device shortly.
Just as with the existing metric tiles, a graph of the last hour’s worth of sensor readings can be accessed by clicking on a metric and the debugging pages can be accessed with a long press.
A Web Server
One of the gripes we’ve always had with the existing UI was the fact that the dashboard HTML page is opened locally by Chromium, rather than being served by a web server. This also meant that running the dashboard on a device other than the ESDK required modifying the Javascript that interfaces with the websocket — by default this pointed to “airquality.local” which also restricted the device hostname from being changed.
To solve this problem we included a simple HTTP server that utilises the Python Twisted library. This provides us with a powerful yet easy-to-use “event-driven networking engine” that allows for creation of a simple web server.
class WebServer:
	def __init__(self, debug=False, loggingLevel='full', port=8080):
		self.logger = AppLogger.getLogger(__name__, debug, loggingLevel)
		self.resource = File('../dashboard')
		self.factory = Site(self.resource)
		self.endpoint = endpoints.TCP4ServerEndpoint(reactor, port)

	def run(self):
		self.logger.debug("Starting web server")
		self.endpoint.listen(self.factory)
		reactor.run(installSignalHandlers=False)
The above code is all that is necessary to build a web server utilising Twisted and is the code that we wrapped up into a helper class which is then accessed from the main AQ application. Port 8080 is used by the server as this does not require the application to run with root privileges which are otherwise necessary to open port 80, and this is a well-documented problem that many others have run into.
def webServerThread(debugEnabled, loggingLevel):
    logger.debug("Started web server thread")
    ws = WebServer.WebServer(debug=debugEnabled, loggingLevel=loggingLevel)
    ws.run()
    logger.debug("Web server should be running")
    while True:
        pass
As the main application is multi-threaded, another thread tasked with handling only the web server was created. This creates an instance of our web server class, calls run() on the instance and then spins in a loop to prevent the thread from rejoining until the application exits.
Presently, the web server returns a full directory listing if the root URL is navigated to i.e. “http://airquality:8080”. The ESDK device dashboard is located at “http://airquality:8080/dash.html” and the new, full dashboard at “http://airquality:8080/dash_full.html”.
We’re working on extending the web server such that one URL (for example “http://airquality:8080/dash”) will return the correct dashboard page depending on the originating request location — for example, the ESDK device will be returned to the device dashboard, and anything else making a request will get the full dashboard.
Buttons
The original design specification that we set out for the ESDK-Main board included four hardware buttons, in addition to the touch screen present on the display. At present only one button was utilised which safely shut down the Raspberry Pi, and as we extended the UI to support new sensors we decided to make use of the other three.
As the UI now needs a left and right keypress to swap between metric pages we opted to use two buttons as arrow keys. This was done by writing a custom device tree overlay that also combines the shutdown button.
right_button: right_button@6 {
    compatible = "gpio-keys";
    #address-cells = <1>;
    #size-cells = <0>;
    pinctrl-names = "default";
    pinctrl-0 = <&right_button_pins>;

    status = "okay";

    right@6 {
        label = "right";
        linux,code = <106>; // KEY_RIGHT
        gpios = <&gpio 6 1>;
        debounce-interval = <50>; // milliseconds
    };
};
The device tree overlay configures the three-button GPIO pins as input mode with a pull-up resistor and additional software debouncing and then sets the compatible property to “gpio-keys” which tells Linux which driver to load to correctly interface with the hardware. A key scancode is also provided in the device tree, which the driver then reads and provides to the operating system when a button is pressed.
We decided upon the bottom button being the shutdown button as has always been the case; the second button is the right key; the third button is the left key and the top key toggles CSV logging which is handled by the AQ application.
The device tree overlay can then be compiled, copied to the boot partition and enabled in config.txt which replaces the existing configuration that utilises the Raspberry Pi-provided shutdown button overlay.
We tested that the overlay worked as expected by using the evtest application which reports input events that the operating system has received. All three buttons showed up as possible input sources and successfully produced a report when pressed and released.
CSV Logging On-The-Fly Toggling
One last feature we wanted to implement was the ability to enable and disable CSV logging on-the-fly, at the press of a button. This took some legwork to rework the existing logging code, but can now be toggled using the last remaining hardware button.
The CSV logging option must be enabled in the configuration file for this to work, as the configuration option acts as a global disable/enable.
def buttonWatcherThread():
    global csvLoggingEnabledState
    while True:
        if GPIO.event_detected(loggingButton):
            if csvLoggingEnabledState:
                logger.debug("Stopping CSV logging on user request")
                csvLoggingEnabledState = False
                debugData.update({'csvEnabled': csvLoggingEnabledState})
            elif not csvLoggingEnabledState:
                logger.debug("Starting CSV logging on user request")
                csvLoggingEnabledState = True
                debugData.update({'csvEnabled': csvLoggingEnabledState})
Another thread was implemented in the AQ application that watches for the fourth button GPIO input going low then high (press then release), and then changes a flag variable which the CSV logging thread monitors.
def csvUpdateThread(debugEnabled, sensorData, hwid, loggingLevel):
    logger.debug("Started CSV update thread")
    global csvLoggingEnabledState
    firstRun = True
    csv = None
    while True:
        if csvLoggingEnabledState:
            if firstRun == True:
                logger.info("Starting CSV logging")
                csv = CsvWriter.CsvWriter(debug=debugEnabled, \
                friendlyName=getFriendlyName(), \
                hwid=hwid['hardwareId'], \
                loggingLevel=loggingLevel)
                firstRun = False

            csv.addRow(sensorData)
            time.sleep(CSV_UPDATE_INTERVAL)

        if not csvLoggingEnabledState:
            firstRun = True
            csv = None
The CSV logging thread was then adapted with an if statement that checks the flag variable and starts logging if enabled. Our initial approach consisted of stopping and starting the thread, but due to underlying technical reasons Python does not support restarting a thread once stopped and creating a new thread instance proved to be too complicated.
Once enabled the code within the if statement sets another flag variable that determines whether an instance of the CSV writer class needs to be created, creates the instance if so and then writes out the file header. After this, the variable is set to false and the file logging continues as normal.
If the logging is stopped the CSV writer instance is disposed of and the thread sits waiting to start logging once again. The instance must be disposed of, as every time a new instance is created a new file with the current date and time is created —which is the desired behaviour so that recording sessions are stored as separate time stamped files, rather than one CSV file with big steps in the timestamps.
To Finish
In this article, we’ve taken a sneak peek at the upcoming features of the next major ESDK release, and some of the technical details including the implementation of the features. We’re currently working on packaging the Air Quality application and ESDK library, so that this can be installed and updated using the Raspberry Pi OS package management system, apt. Once this work is completed we should be ready to make a new release.