A Simple Tool to Evaluate your headphone
Follow article Dave from DesignSpark
How do you feel about this article? Help us to provide better content for you.
Dave from DesignSpark
Thank you! Your feedback has been received.
Dave from DesignSpark
There was a problem submitting your feedback, please try again later.
Dave from DesignSpark
What do you think of this article?

This guide is a starting point to use Red Pitaya to analyze and evaluate your headphone. There are many features to analyze the headphone. We are going to using “frequency response” and “frequency range” to testing the headphone. If you really want to know more about how other people evaluate the headphone, you can go to this link to have a look.
So, what you need in this guide is:
1. A Red Pitaya
2. Your personal Headphone
3. A microphone which I am using “KEYES KY-038”

4. A computer with MatLab
If you haven’t heard any about MatLab, you can go to here to have a taste of MatLab.
Setting Up
Thanks to the powerful Red Pitaya, you can do all the connection on the board.
For example, we can connect our headphone to two RF output channels which can generate any waveform with a voltage range of +/- 1V.
The two RF input channels can read the data from the microphone.
So here, I will teach how to connect all the stuff.
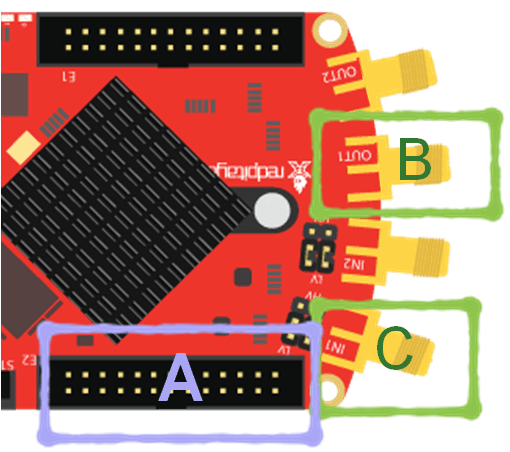
There are three parts to connect the stuff.
Part A is used to give power to the microphone.
Part B is a RF output which used to connect to the headphone.
Part C is a RF input used to receive the microphone data.
- - - - - - - - - - - - - - - - - - - - - - - - - - - - - - - - - - - - - - - - - - - - - - - - - - - - - - - - - - - - - - - - -


Part A:
The mic needs power. There is one +5V pin and three GND pins on Red Pitaya
Part B:
There are two types of 3.5mm jacks. One has Four pins and the other one has three pins.

Pin 1: GND
Pin 2: Mic
Pin 3: Right headphone
Pin 4: Left headphone

Pin 1: GND
Pin 2: Right headphone
Pin 3: Left headphone
- - - - - - - - - - - - - - - - - - - - - - - - - - - - - - - - - - - - - - - - - - - - - - - - - - - - - - - - - - - - - - - - - - - - -
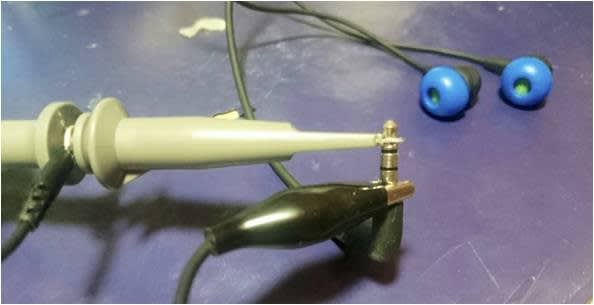
You need to put the probe hook to the Right headphone or Left headphone depends on which side you want to test.
And don’t forget to put the probe ground lead clip to the headphone Pin 1 GND.
- - - - - - - - - - - - - - - - - - - - - - - - - - - - - - - - - - - - - - - - - - - - - - - - - - - - - - - - - - - - - - - - -
Part C:

This part is to connect the probe hook to the Analog output of the microphone.
No need to connect the probe ground lead clip as you have connected the GND. The GND have connections inside the Red Pitaya Board.
Connect to the Computer:
After Connect all the stuff, you also need to connect your Red Pitaya to the computer. Ways to connect the computer are here.
Connect to the MatLab:
Also, I assume you have successfully connect the Red Pitaya via MatLab after reading this instruction.
Go to Red Pitaya Page by enter your presented IP address. And Click on “Run” at “Generator & Oscilloscope”.

If you set the signal generator, and enable channel 1, you will hear the headphone started to produce sound.
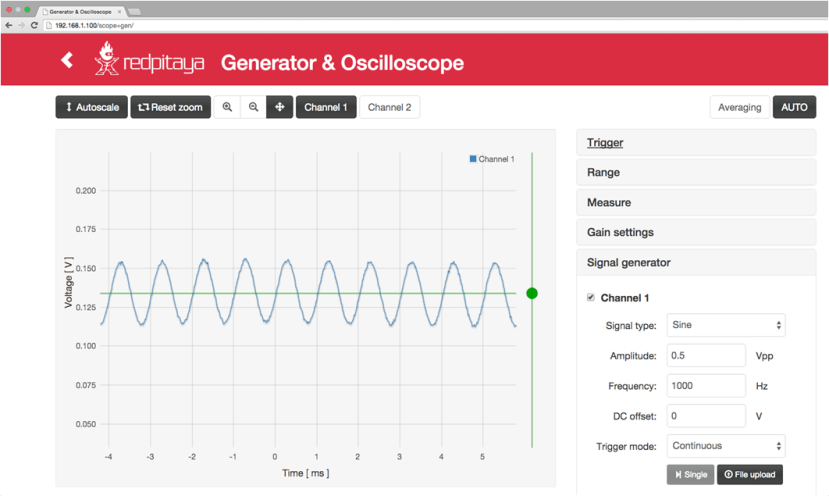
By modify different Frequency, different Amplitude, different Signal Type, and different DC offset, you should here different kinds of sound.

I have changed the scale of the probe from x1 to x10, and using “LV” mode to read the value, so the value will be very small in my graph.
If you cannot hear any sound or the sound is very small, it may be the sensitivity of your headphone is too low.
Sensitivity indicates how loud the earphones will be for a given level from the source. So if your headphone need to drive by amplifier or cannot drive by smartphone, I rather not suggest you to use this headphone for this guide. You need to build extra circuit,example build a signal amplifier for this test.
MatLab Programming:
Example 1 : Generate a waveform using MatLab
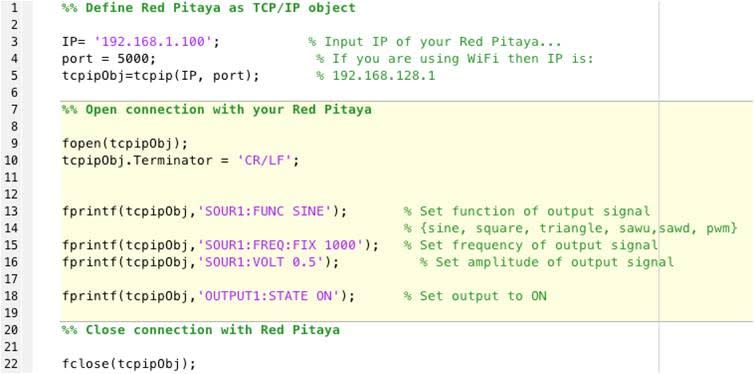
Add a new script and Run the code in MatLab.
You can change the sound by modifying the “FUNC”, “FREQ”, and “VOLT”.
It actually same as Web GUI, but you need to change the sound by changing the code.
Now, you know how to make the sound by MatLab. But how to change the frequency by the program. I would rather use for loop help me to have progression of sound.
Example 2: Generate waveforms using for loop
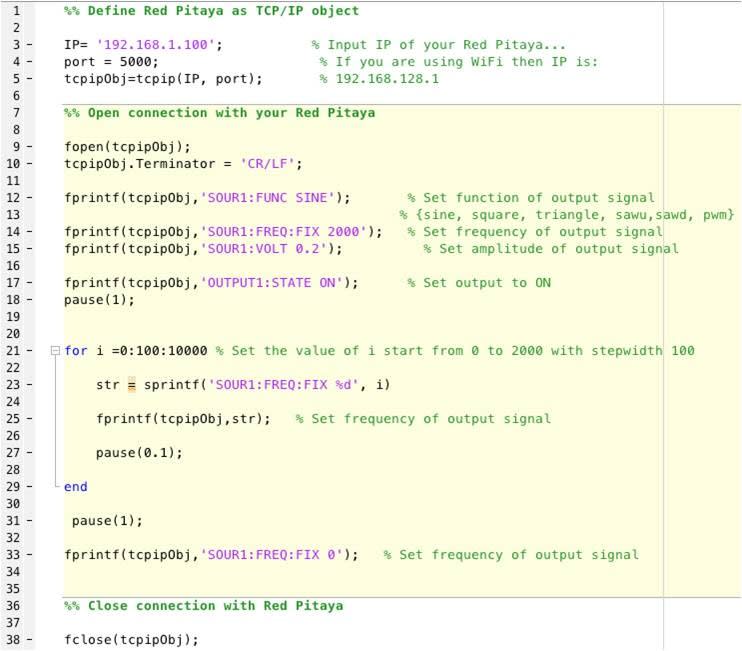
Applying the above code, you will hear the sound from low to high with a delay of 0.1 sec.
You need to get back the data from the microphone, so you need to add some code to acquire the data.
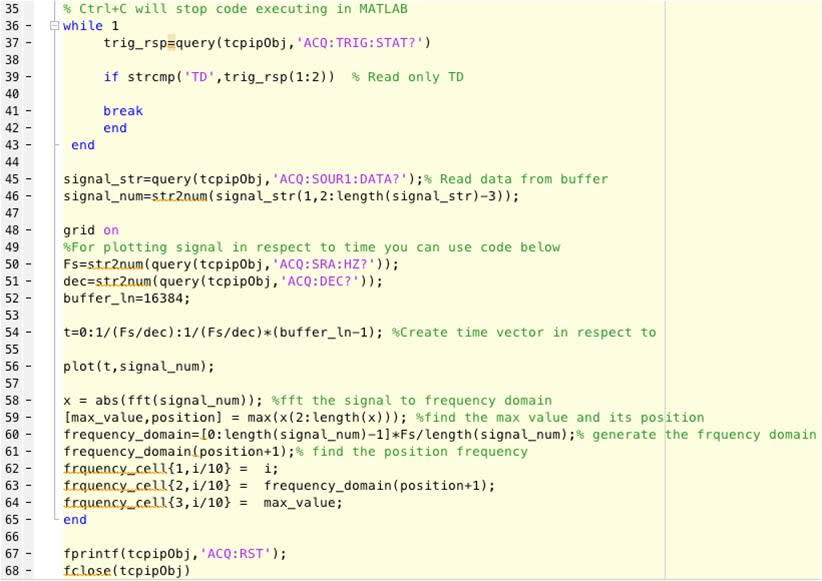
Example 3: Generate a waveform , get back the data from microphone and plot the graph

Run the Code, you can get graph generate by MatLab. The graph is analog output of microphone versus time.
Now you get the sound waveform of your headphone generate in kHz. You need to verify is it 1kHz.
Example 4: add FFT and print the value
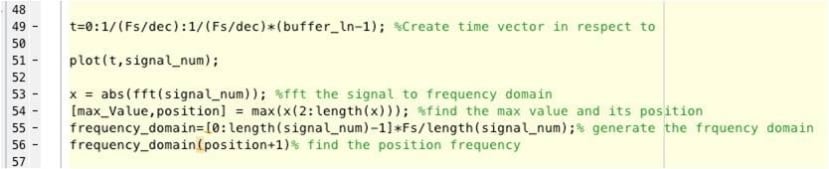
Add the above code after plot in example 3.
Run the code and you will the corresponding frequency of the signal. In this case, you will get 999.9365, which is 1kHz.
- - - - - - - - - - - - - - - - - - - - - - - - - - - - - - - - - - - - - - - - - - - - - - - - - - - - - - - - - - - - - - - - - - -
Combine all the example above, you should able to write a program to get all the frequency of the headphone.
Here is some suggestion for the MatLab Code.
From Frequency 0 to 1000, using decimation of 1024 will be better.
fprintf(tcpipObj,'ACQ:DEC 1024');% Set decimation vale (sampling rate) in respect to you
Here is my Example

You will get a set value from the microphone.
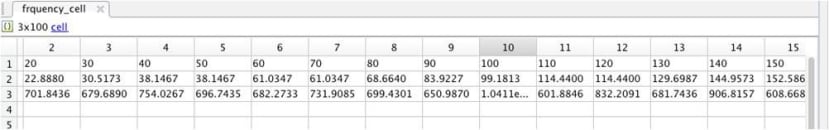
The first column is the frequency we are testing, second column is the frequency from the microphone. The third column is about the magnitude of the sound.
You can plot the graph to know what is your headphone performance.