Raspberry Pi 4 Personal Datacentre Part 3: A Self-hosted IoT Data Platform
Follow article
 Dave from DesignSpark
How do you feel about this article? Help us to provide better content for you.
Dave from DesignSpark
Thank you! Your feedback has been received.
Dave from DesignSpark
There was a problem submitting your feedback, please try again later.
Dave from DesignSpark
What do you think of this article?
Setting up a self-hosted IoT data platform on a Raspberry Pi 4 with Mosquitto, Node-Red, InfluxDB and Grafana.
In this series of posts we show how a Raspberry Pi 4 can be used to create a personal cloud solution that is managed using Ansible and Docker — powerful tools that are used by many large scale cloud platforms, which automate configuration tasks and provide containerisation for applications.
The first post took a look at initial O/S configuration, followed by setting up Ansible and Docker, and then finally installation of Nextcloud using these tools. The second post looked at setting up Home Assistant, an open source home/building automation solution that puts local control and privacy first. In this post we now take a look at installing software for a fully self-hosted data platform, that could be used to store and visual data for all manner of sensor and IoT applications.
Stack
Before we get hands-on let’s first take a look at the data platform stack that we’ll be using.
Node-RED will be well known to many and is an incredibly powerful tool for wiring the Internet of Things. In short, it enables the creation of IoT applications with minimal coding, by connecting sensors and other inputs to processing blocks, custom functions, and a wide array of outputs. It is also supported by a vast number of third party “nodes” which extend its functionality.
Mosquitto is often used hand-in-hand with Node-RED and provides a broker for MQTT, a lightweight, easy-to-use messaging protocol. There are many IoT products on the market today that make use of MQTT, along with no shortage of development platforms that include support for it.
InfluxDB is a database for storing “time series data”, or in other words measurements that are collected over a period of time and ordered chronologically.
Grafana is an open source analytics and visualisation platform, that amongst other things, can make present data that is stored in InfluxDB.
For example, we might have data that is provided via a web API, either from a local IoT device or a remote cloud platform. We can use Node-RED to retrieve that data and, if necessary, process it in some way or perhaps combine it with other data. We may also have devices that publish measurements via MQTT and these could be configured to use the Mosquitto broker. Actuators and other outputs, such as heating control or a status display, may also subscribe to topics on the broker.
Having real-time inputs and outputs connected together is all very well, but what if we want to check sensor readings from earlier this morning or last year? This is where InfluxDB and Grafana come in, by providing persistent storage of measurements and a means of visualising these.
Hardware

We used a Raspberry Pi 4 B 8GB (182-2098) , together with the new PoE+ HAT (221-1857) (check RS for latest stock update) and KKSB steel and aluminium enclosure (202-4895) . A Pi with much less memory would suffice, but obviously the more RAM you have, the more applications you can run side-by-side, and there is no reason why a Pi 4-based private cloud server couldn’t host quite a few, provided they are configured such that they don’t try to use the same TCP/IP port numbers etc.
The nice thing about PoE is that we can have just one cable to the Pi, but if you don’t have a PoE capable switch, a USB-C PSU (187-3416) can obviously be used instead. A Micro SD card that is suitably sized for your storage requirements will be required also.
Raspberry Pi OS, Ansible and Docker
We started by downloading the latest Raspberry Pi OS (Raspbian) Lite image, which at the time of writing is dated 7th May 2021. This was then written out to a Micro SD card with:
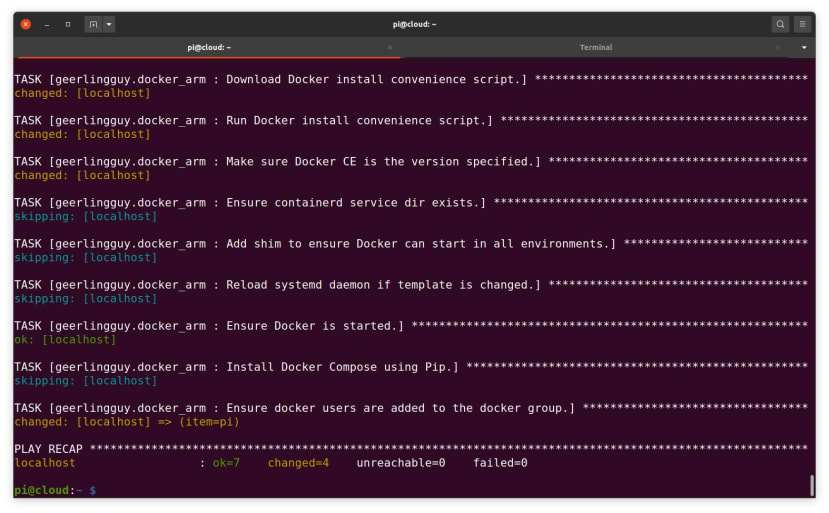
$ sudo dd if=2021-05-07-raspios-buster-armhf-lite.img bs=1M conv=fsync status=progressRather than detail in full all the steps that are required for initial setup and to install Ansible and Docker, please consult Part 1 in this series — in particular, the Basic setup, Ansible and Docker installation sections. Then if everything went according to plan, output similar to that shown above should be seen when running the Ansible playbook that installs Docker.
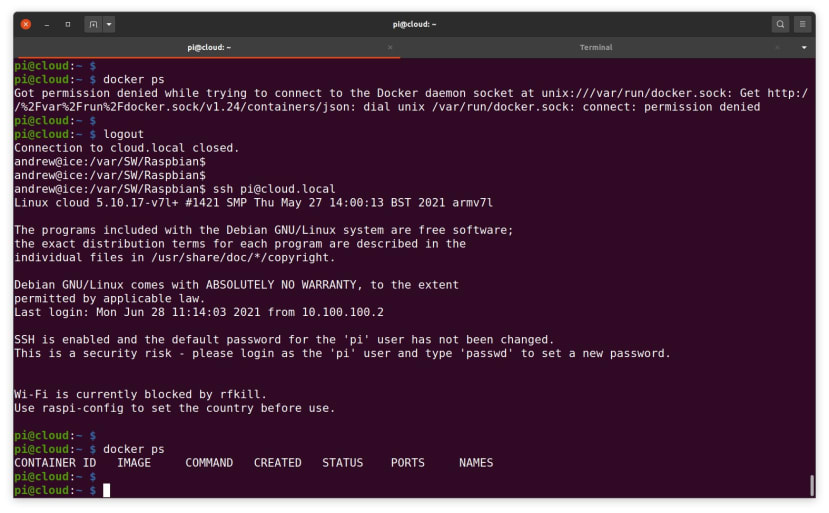
After logging out and back in again so as to pick up the new docker group, it should then be possible to run docker ps without any errors. At this point we can now proceed to installing the data platform stack.
Node-RED, Mosquitto, InfluxDB and Grafana
Next we need to create a new playbook called data-platform.yml, with the following contents:
---
- name: "Data platform playbook"
  hosts: localhost
  connection: local
  become: yes
  vars:
    if_read_pass: 'readonly'
    if_write_pass: 'readwrite'
    if_admin_pass: 'admin'
    gf_admin_pass: 'admin'
  tasks:
    - name: Create data platform network
      docker_network:
        name: dataplatform
        driver: bridge
    - name: Create Node-RED container
      docker_container:
        restart: yes
        restart_policy: always
        name: nodered
        image: nodered/node-red
        pull: yes
        state: started
        networks:
          - name: dataplatform
        volumes:
          - 'nr-data:/data'
        ports:
          - '1880:1880'
    - name: Create Mosquitto container
      docker_container:
        restart: yes
        restart_policy: always
        name: mosquitto
        image: eclipse-mosquitto:latest
        pull: yes
        state: started
        networks:
          - name: dataplatform
        volumes:
          - 'mq-data:/mosquitto/config:ro'
        ports:
          - '1883:1883'
    - name: Create InfluxDB container
      docker_container:
        restart: yes
        restart_policy: always
        name: influxdb
        image: influxdb:1.8
        pull: yes
        state: started
        env:
          INFLUXDB_DB: 'cloud'
          INFLUXDB_READ_USER: 'read'
          INFLUXDB_READ_USER_PASSWORD: '{{ if_read_pass }}'
          INFLUXDB_WRITE_USER: 'write'
          INFLUXDB_WRITE_USER_PASSWORD: '{{ if_write_pass }}'
          INFLUXDB_ADMIN_USER: 'admin'
          INFLUXDB_ADMIN_PASSWORD: '{{ if_admin_pass }}'
          INFLUXDB_HTTP_ENABLED: 'true'
          INFLUXDB_HTTP_HTTPS_ENABLED: 'false'
          INFLUXDB_HTTP_AUTH_ENABLED: 'true'
        networks:
          - name: dataplatform
        volumes:
          - 'if-data:/var/lib/influxdb'
        ports:
          - '8086:8086'
    - name: Create Grafana container
      docker_container:
        restart: yes
        restart_policy: always
        name: grafana
        image: grafana/grafana:latest
        pull: yes
        state: started
        env:
          GF_SECURITY_ADMIN_PASSWORD: '{{ gf_admin_pass }}'
        networks:
          - name: dataplatform
        volumes:
          - 'gf-data:/var/lib/grafana'
        ports:
          - '3000:3000'
This is similar to the playbook that we previously created for Home Assistant, albeit somewhat larger. At the top of this we declare some variables for application passwords:
- if_read_pass = InfluxDB read-only user
- if_write_pass = InfluxDB read/write user
- if_admin_pass = InfluxDB admin user
- gf_admin_pass = Grafana admin user
We could have set these further down in the respective Ansible tasks, but having the variables at the top of the file makes it a little quicker, easier and less error prone to make changes.
The first task is one that we’ve previously not encountered and creates a Docker network called dataplatform, that we will then subsequently connect each of the containers to. This is a private network that containers can use to communicate with each other. One of the nice features of this, is that an app running in one container, can connect to app running in another via the private network by using just use the name of the container as the hostname.
Next, we have the tasks that pull down the application images for each container and configure them. Note how for InfluxDB we have not used an image tag of “latest” and instead specified “1.8”. This is because InfluxDB package arm architecture Docker containers for version 2.0 of their software onwards only for use with a 64-bit O/S. One option would be to install a beta of the 64-bit Raspberry Pi OS, but a 32-bit O/S and slightly older version of InfluxDB is sufficient.
At this point we can now run the playbook:
$ ansible-playbook data-platform.yml
And if all goes well we should see output similar to that shown above.
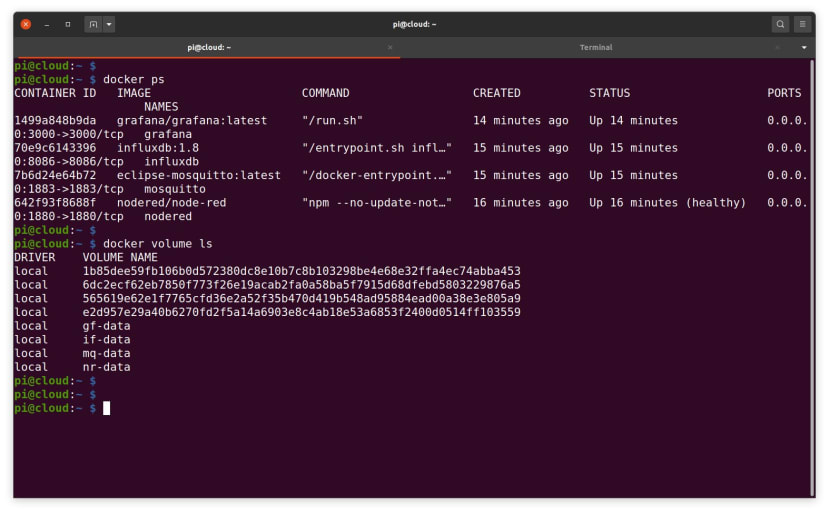
Just to double-check, we can then run docker ps and docker volume ls to confirm that our containers are up and running and their respective volumes have been created.
Now on to some basic configuration and simple examples.
InfluxDB support in Node-RED

The Node-RED web interface should be available at http://HOSTNAME.local:1880. Support for using InfluxDB as a data store is not included by default, so this will need to be installed by clicking on the three bars top-right and selecting Manage palette → Install.

From here we can then search for “influxdb” and then select to install node-red-contrib-influxdb nodes.

Following which we should have the InfluxDB nodes in the palette under storage.
Most of the time we’ll likely want to use Node-RED to process data from a sensor, some other device or perhaps a remote web API, then store this in a database. Visualisation will then be via dashboards created in Grafana. However, we can also use Node-RED to retrieve stored data and could use this to create a web dashboard, albeit with not quite the same convenience. Though we may also have other uses for getting data from InfluxDB into Node-RED, such as perhaps to control a physical output, e.g. an indicator, alarm or a maybe remote control a heating system.
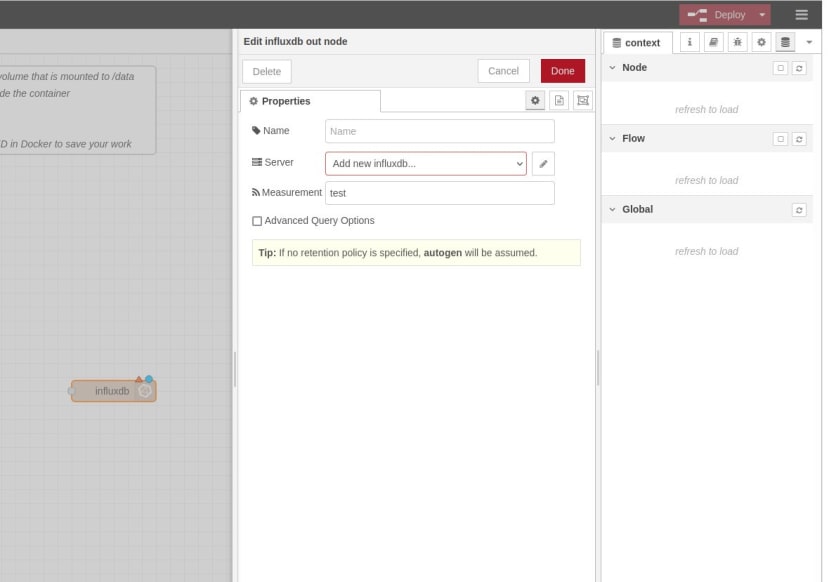
In any case, we’ll start with the out node and if we drag this onto the flow and double-click on it.
We then enter a measurement name of “test” and click the pencil icon next to the Server field to add a new InfluxDB instance to connect to.

Values are entered as configured in the Ansible playbook: database name of “cloud”, username “write” and password “readwrite”. Since Node-RED is running inside a container, we also need to change the Host value from 127.0.0.1 (loopback) to “influxdb”, the name of the container which we will be connecting to over the Docker private network. Following which we click Add and Done.

What we’ve done next is to add an Inject node and left it with the default of sending a timestamp in msg.payload, but set the Repeat to an interval of 1 second.
Inside the Function node we have:
msg.payload = Math.random()*10;
return msg;
So if we now select Deploy, every second a random number will be generated and written to an InfluxDB measurement called test. To quickly confirm this we can install the InfluxDB command line client from the shell prompt with:
$ sudo apt install influxdb-clientFollowing which we can connect to the database with:
$ influx -database cloud -username admin -password admin
At the Influx prompt we can list the measurements in the cloud database.

And we can select all the measurements for name: test, which returns a list of timestamps and the random values that have so far been generated by our Node-RED function. Obviously if we leave this test flow running, the database will increase by one measurement every second.
InfluxDB has a powerful query language, we’ve barely scratched the surface here and a good place to find out more is the query language reference and in particular, the Explore your schema section.
Now on to visualising our time series data in a much more convenient and eminently useful manner.
Grafana setup

If we open a new browser tab and point this at http://HOSTNAME.local:3000, we should be greeted with a login page and here can enter admin/admin.
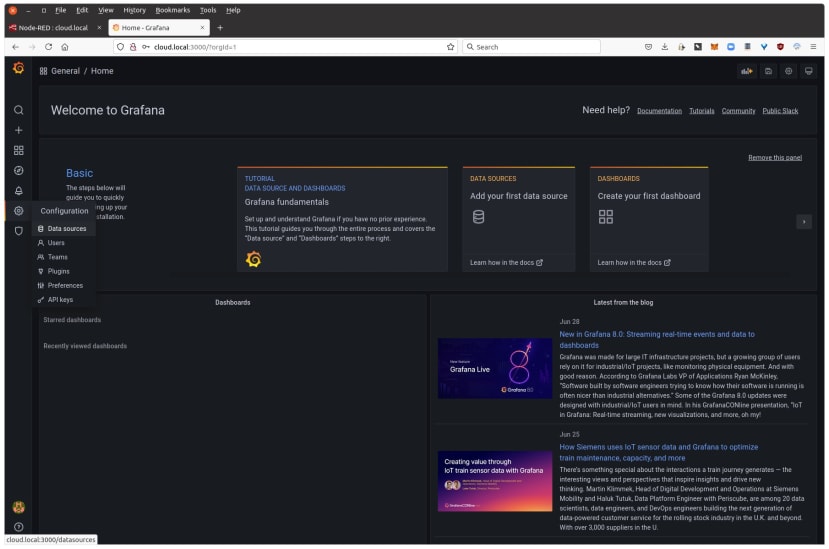
On the left-hand menu we need to navigate to Configuration → Data sources. Following which Add data source → InfluxDB. Note how we can add lots of other types of data source also.

Remembering that the hostname to use in the URL field is “influxdb” instead of 127.0.0.1.

We can use our read-only user credentials here, since Grafana shouldn’t need write access to the database. Finally, we can select Save & test, which should complete without error.

We can now select Create → Dashboard from the left-hand navigation. Followed by Add an empty panel.

In the query editor all we should have to do now is to select the “test” measurement in the line starting FROM, following which the panel should be updated with a plot of the data in InfluxDB.

There are an awful lot of options when it comes to configuring Grafana and we can display mean or last measurements values for example, present the data in many different ways, plot different measurements against each other in the same panel, create new panels, new dashboards, set thresholds and so on. For further details, see the documentation.
Mosquitto

If we were retrieving data from a public cloud API we could use a HTTP node to achieve this, while some applications may also be able to connect directly to InfluxDB. However, MQTT is a widely used messaging protocol for IoT and if we want to support this without any reliance on third party services, we’ll need our own broker. In our case we have Mosquitto installed, but as of v2.0 we need to make some simple changes to the default configuration in order to use it.
We can edit the Mosquitto config file with:
$ sudo nano /var/lib/docker/volumes/mq-data/_data/mosquitto.confNext we need to add two lines to the end of the file:
listener 1883
allow_anonymous true
Following which restart the docker container with:
$ docker restart mosquittoWithout these changes we wouldn’t be able to connect to the broker.
In order to test we can install the Mosquitto command line clients.
$ sudo apt install mosquitto-clientsAnd then to publish an arbitrary value to a test topic we can use mosquitto_pub, e.g.:
$ mosquitto_pub -t test -m 32
In Node-RED we have an MQTT in node, which is configured to connect to a host named “mosquitto” (container name) and subscribe to a topic called test. The output of this is then sent to a Debug node.
Developing applications
At this point we now have all the infrastructure for our data platform and it would be a matter of figuring out what devices and services we would like to connect, along with the data storage requirements — e.g. measurement frequency and resolution etc. — and visualisation requirements. Node-RED provides us with no shortage of options for getting data in, processing and acting upon it, and getting data out. Likewise, Grafana supports many other data sources along with InfluxDB.
Volumes and customisation
All of our containers are using Docker volumes, rather bind mounts which make a filesystem directory available inside the container. At first volumes may seem a little more hassle, since it’s not immediately apparent where files live, but in fact they offer many benefits, such as the ability to use a volume driver where the actual storage is on a remote host accessed by ssh or NFS, for example.
Some useful Docker volume commands are:
$ docker volume ls
$ docker volume inspect <volume>
These list the volumes and inspect a volume to, amongst other things, reveal where the files reside.
Note that if you delete a container, by default the volumes remain, which means that you can stop and delete a container, then redeploy with new configuration, or perhaps to pull a later version of it, and have this fresh container use the existing volume(s) with all of your config and/or user data.
A final word on security
The assumption has been made that this will be running on a secured private network and hence we’ve not configured things like SSL/HTTPS. However, you may still wish to look into this (see the application documentation) and also things like:
- Mosquitto access control. Setting up users and passwords etc.
- Node-RED access control. None by default!
- InfluxDB security. User accounts set initially in the playbook.
- Grafana security. User accounts set initially in the playbook.