CNC Router Process Optimisation with ST IO-Link Solutions Part 2: Hardware Installation & Test
Follow article
 Dave from DesignSpark
How do you feel about this article? Help us to provide better content for you.
Dave from DesignSpark
Thank you! Your feedback has been received.
Dave from DesignSpark
There was a problem submitting your feedback, please try again later.
Dave from DesignSpark
What do you think of this article?
Designing a suitable enclosure for the IO-Link sensor board, fitting it to the CNC router, and performing basic operational tests.
In part one of this series, we took a look at common machining issues encountered when running a CAM job, and how to identify and alleviate these issues. We also evaluated IO-Link evaluation kit offerings provided by STMicroelectronics, and selected one with the sensors that would be most suitable for our application.
In this post we’ll be building a suitable enclosure for the sensor board, installing this on our CNC machine and then gathering some preliminary data to confirm basic operation of our measurement solution.
Building an Enclosure
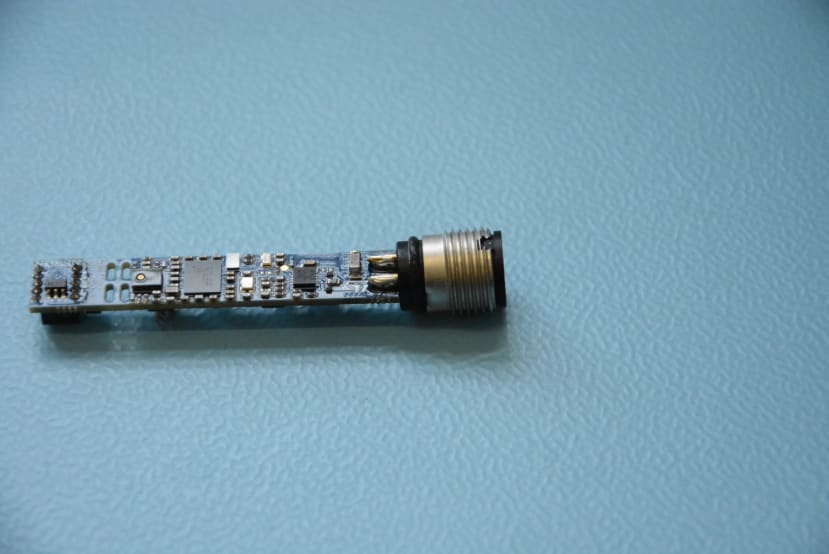
As we’ve settled on using the ST STEVAL-BFA001V2B (201-3600) kit that contains a small sensor board, we needed to design a suitable enclosure to keep everything protected.
Designing the enclosure is somewhat complicated by the fact that there is a temperature & humidity sensor and microphone on-board, all of which need to be exposed to the atmosphere to work properly. However, inside the CNC router is a challenging environment for ensuring the continued proper operation of electronics, due to coolant mist and flying metal chips being present.
As the sensor board is designed as a compact evaluation board, no mounting holes are provided that could be utilised and so we had to get creative with our mounting solution. We initially considered fixing the PCB inside a small “potting box” enclosure of the right size (314-5229) , but then decided that this wasn’t the best solution.
We eventually settled on using an acrylic tube to protect the sensor board; utilising the M12 connector on the top of the board, the acrylic tube slides up to this and is held in place with a friction fit and o-ring for sealing. To close the bottom end of the tube, two laser cut disks of acrylic were used that could sandwich a piece of filter material, to provide passage of sound and humidity but restrict coolant mist and chips.
The last remaining step was to find a suitable filter material to provide a barrier against atomised coolant and cut chips, settling on using a material that is now well known to all of us — a face mask. We decided this would be a good material to use as they are designed to pass air and moisture (important for the humidity sensor), but filter out particulate matter. Additionally, as the mask material is quite thin, noise travelling to the microphone should not be heavily attenuated.
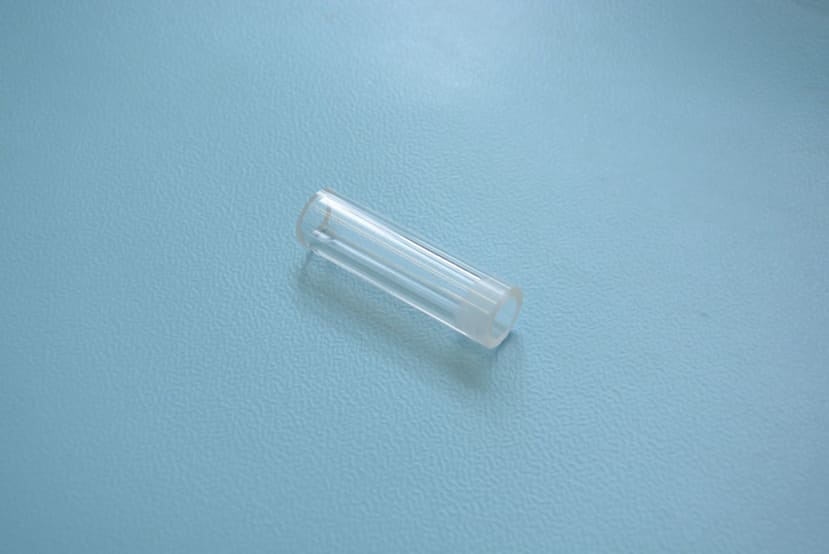
With our part choices made, we began to assemble the sensor enclosure. The first step was to cut the acrylic tube to just longer than the sensor board, and then slightly enlarge the end using a tapered reamer to produce a friction fit on the sensor board connector. A 10mm internal diameter tube was selected having measured a connector diameter of 10.5mm.
A small o-ring was also installed on the shoulder of the M12 connector to provide a seal on top of the tube and some additional retention force.

The two acrylic discs were cut, with two holes to allow for the installation of M2 screws to clamp the disc of fabric between. One of the acrylic disks was then glued to the end of the tube opposite the connector, a disk of fabric cut and then the remaining acrylic disk was screwed into place — completing the sensor enclosure.

We then installed the IO-Link master into an appropriate enclosure (533-7739) , with a short cable to bring the M12 connector to the outside of the box. A USB pass-through was also fitted to allow for connection to a computer, along with a cable gland for the power supply. This enclosure was then bolted onto the existing mounting rail on the side of our CNC router.
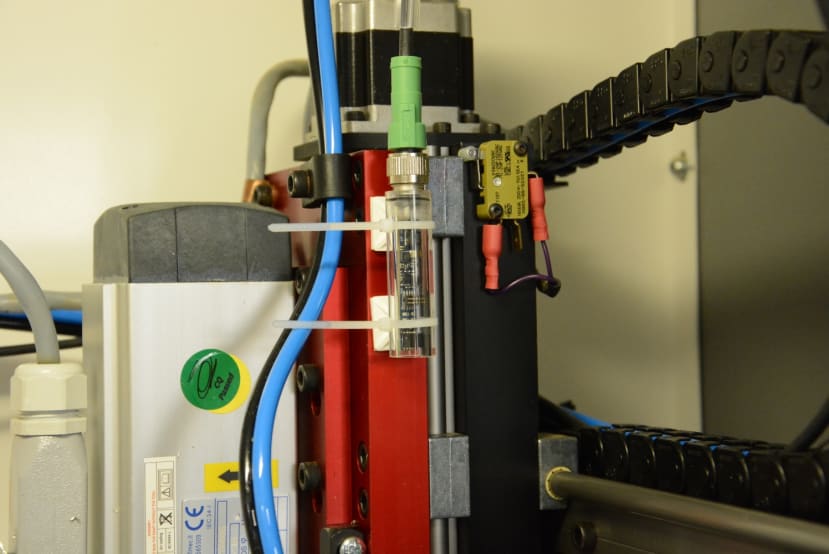
All that was left to do was affix the sensor to the spindle of the CNC router and then route the cable. Self-adhesive cable tie bases were used to hold the sensor enclosure, and then the cable was inserted into the existing cable snake.
Preliminary Testing
With all the componentry attached to the router, we could move onto preliminary testing to make sure the sensor would be able to gather the data we wanted.
As the sensor is mounted vertically with the connector facing up, the accelerometer axes map to the machine axes as follows: sensor X-axis becomes the machine Z-axis, sensor Y-axis becomes the machine X-axis, and sensor Z-axis becomes the machine Y-axis. All the figures below will be using the sensor axes rather than the machine axes.
To start with, we installed the demonstration application on our CNC control PC and then took a series of measurements with the machine running a warm-up cycle, with a two-flute end mill.
The set of measurements we took involved running the machine warmup cycle as per the instruction manual — this consists of running the spindle at 50% maximum speed (12000 rpm) for five minutes, three minutes at 80% maximum speed (19200 rpm), and finally two minutes at 100% speed, or 24000 rpm. A vibration FFT was triggered at each spindle speed step, and a screenshot of the resultant plot was taken.

As shown in the screenshot above, the spindle running at 12000 rpm produces frequency components predominantly in the Y- and Z-axis. The greatest Y-axis peak is found at 183Hz, and the greatest Z-axis peak is at 8793Hz. Three peaks all at the same frequencies are found in all three axes, at approximately 7700Hz to 8800Hz.

As with the 12000 rpm test, the frequency components at 19200rpm are predominantly in the Y-axis with the greatest peak located at 4346Hz. Again, smaller peaks are common to all three axes with one peak at around 8700Hz, and a cluster from around 100-1000Hz.

With the spindle at full speed, the frequency components caused by vibrations suddenly shift. The largest peaks are found in the X-axis, with the largest peak at 419Hz. More peaks are common between the three axes at 24000 rpm, with a correlation at approximately 800Hz, 1200Hz, and 8900Hz and some smaller ones in between.
The above data will come in useful for building up a picture of what the machine looks like in a healthy condition with an unloaded spindle. More data will need to be collected with the machine running a number of different jobs, including ones that work well and ones that work poorly to be able to figure out performance.
To Finish
In this article, we’ve built a protective enclosure for the STEVAL-BFA001V2B sensor module, installed this on our CNC router and gathered some preliminary test data to check the basic operation of the sensor.
In the next article, we’ll take a look at the log file output format from ST’s evaluation application, then write a Python script to handle the files and produce a more useful output format that can then be further processed by other applications. We’ll also gather some comparison data when running a successful machining job, versus an unsuccessful one.