Breathing Dress: Update #3
Follow article
 Dave from DesignSpark
How do you feel about this article? Help us to provide better content for you.
Dave from DesignSpark
Thank you! Your feedback has been received.
Dave from DesignSpark
There was a problem submitting your feedback, please try again later.
Dave from DesignSpark
What do you think of this article?
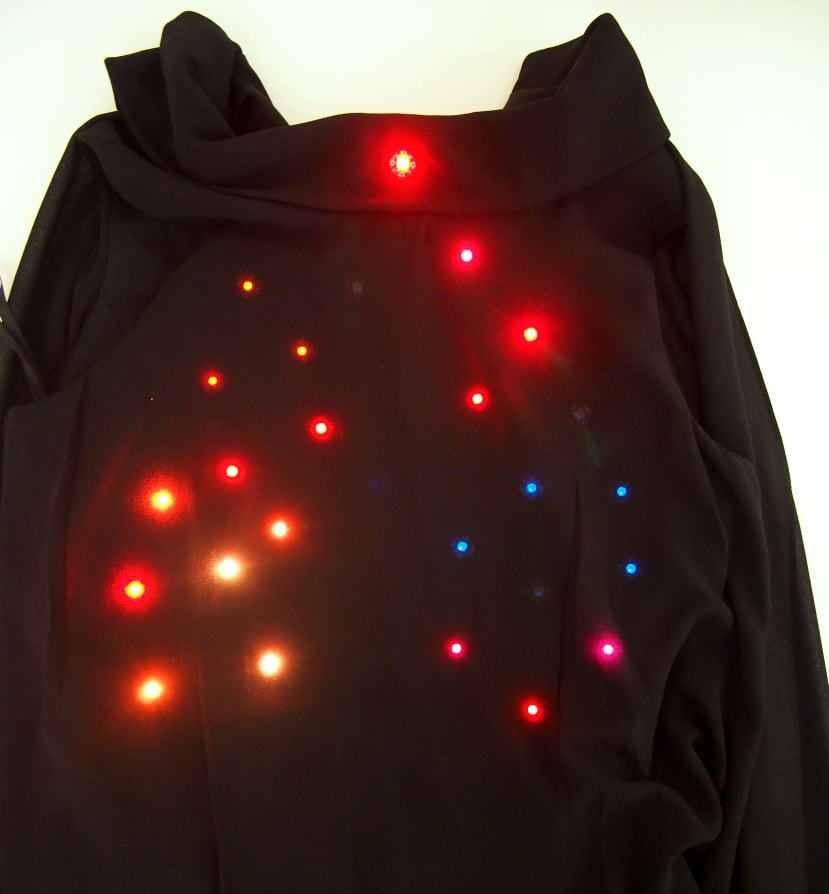
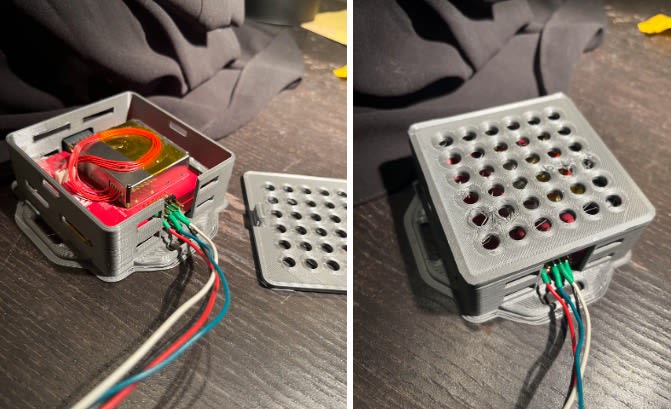
With the neopixels in place, the final step was to integrate with the air quality sensor! Yuki designed an enclosure in CAD which he then 3D printed and attached to the shoulder of the dress.
For the visualization of the air quality with the LEDs, we used a colour scheme defined by the 24-hour average exposure recommended by US EPA breakpoints shown below:
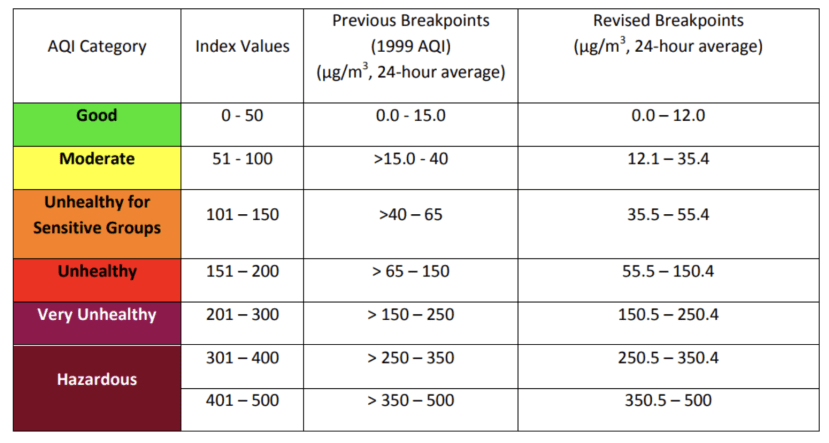
(Note that WHO has recently published a new air quality guideline, accessible here)
The recommended annual exposure for PM2.5 is 10 µg/m3 . EPA is also looking to update their standards by next year, but for this project, we’ll stick with what is published for the proof of concept of our project.
Following the EPA guideline, we set Green LED values to shine when PM2.5 is below 12 µg/m3. When levels go above this threshold we change the LED colour from Green to Yellow. We then turn the LEDs red when PM2.5 readings are above 55.5 µg/m3.
Here's a video of the final project in action:
You'll note that the LEDs sometimes blink instead of transitioning more smoothly between colours. One lesson we learned during this project was that it can be difficult to get a stable connection with the hand-sewn conductive thread. For future iterations, we would want to explore ways to better stabilize the connection to fully utilize the potential of the addressable LEDs.
Because of the instability of the LED connections (particularly with the data pin), our initial idea of LEDs changing to represent years of lives lost couldn’t be implemented with the current prototype. However, Yuki describes below his idea for how to use the most up-to-date science for how it could be implemented into future visualizations.
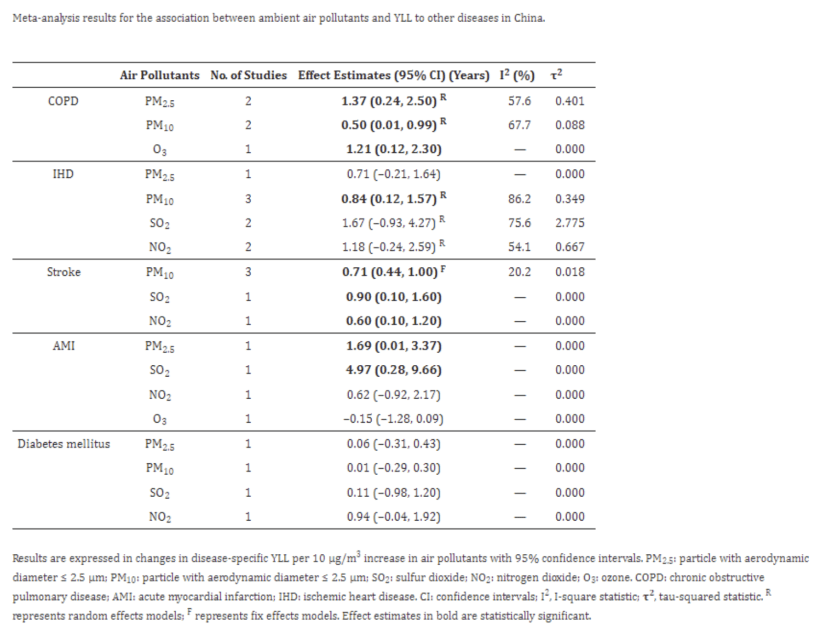
Yang Ni, et. Al (2021) shows that every 10 µg/m3 increase in PM2.5 is associated with an upper estimate of 1.37 years of lives lost to COPD. (https://www.ncbi.nlm.nih.gov/pmc/articles/PMC8582650/)
To portray and emphasize the effect PM2.5 exposure has on health through our dress and keep the implementation simple, we can approximate 1 year lost per 10µg/m3 increment. We have 24 LEDs, In the UK, the average life expectancy is around 80 years old (https://www.worlddata.info/life-expectancy.php). Each LED would mean 3.3 years of life.
This means that for every 30µg/m3 increment we can turn 1 led Red, for the dress to represent the proportion of your life lost due to exposure, assuming that you are exposed daily to the pollution level.
Despite the difficulties with the LEDs, the Breathing Dress was a fun proof-of-concept! It gave us the chance to explore the world of wearables and data visualization and to learn more about the importance of air quality to our overall health.