AQ Project How to Part 2: A First Look at the ESDK Air Quality Application
Follow article
 Dave from DesignSpark
How do you feel about this article? Help us to provide better content for you.
Dave from DesignSpark
Thank you! Your feedback has been received.
Dave from DesignSpark
There was a problem submitting your feedback, please try again later.
Dave from DesignSpark
What do you think of this article?
App reads sensors, drives local display and posts data to cloud metrics platform.
The DesignSpark Environmental Sensor Development Kit (ESDK) hardware is at the heart of the DesignSpark Air Quality project. Support for reading its sensors is provided by the DesignSpark.ESDK Python module and in this article we take a look at the AQ application which builds upon this, to display readings on the ESDK touch screen and post metrics to a cloud database and analytics platform.
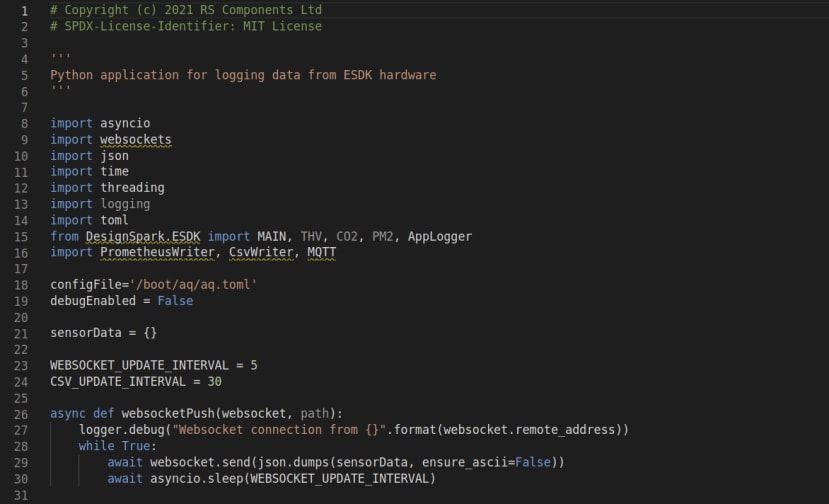
DesignSpark.ESDK
The ESDK Python support module enables:
- Getting the Raspberry Pi hardware serial number
- Probing the I2C bus to detect sensors
- Reading ESDK sensor modules
- Implementing algorithms to convert raw readings to meaningful values
- Reading GPS
- Providing helper functions as required, e.g. implementing cyclic redundancy check (CRC)
It’s still early days for the Python module and this will be evolved over time, to not only include support for additional sensor hardware, but to also improve its architecture and features.
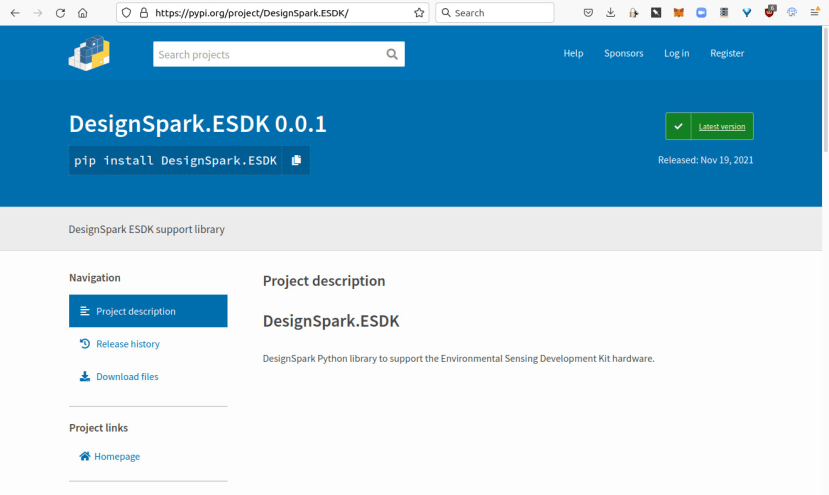
This functionality is being developed as a module — rather than simply being integrated into the main application — and has been published to the Python Package Index (PyPI), since the ESDK hardware could be put to use in many other applications and this will help to enable code reuse.
Application
Python back-end
In short the Air Quality application Python code:
- Reads sensors via DesignSpark.ESDK
- Publishes readings via a WebSocket API
- Publishes readings via MQTT if a broker is configured
- Publishes readings to Prometheus if one or more endpoints are configured
We’ll come on to the WebSocket API later. MQTT is particularly useful if you have a need for local machine access to readings, or perhaps a remote broker that is already set up. While Prometheus is a time series (chronologically ordered) database which is used by the DesignSpark Metrics cloud. The cloud platform used by the Air Quality project will be covered in a separate article.
Web front-end
Various options were considered for creating the local display graphical user interface, such as the Qt widget toolkit. In the end it was decided to build it as a web page and then to display this via a browser started in kiosk mode. This has the benefit of a lower barrier to entry for the wider community getting hands-on creating custom interfaces, since basic skills in HTML, CSS and JavaScript are more common than experience with native application GUI toolkits.
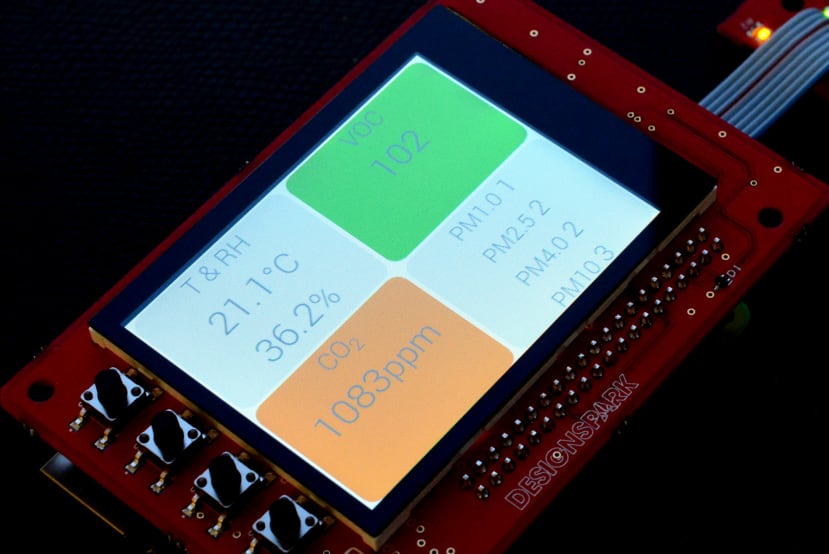
At present there is a single, simple web page with four boxes: one each for temperature + humidity, TVOC, CO2 and particulate matter. Metrics are updated by JavaScript client-side code, which receives data from the Python application via the WebSocket API.
There are plans to evolve the web interface over time and to have multiple screens, with added support for things like config and status information, charts, and also network access with a responsive design that adapts to the screen size. At the present time the interface is local only, but in the meantime those keen to experiment can easily load up the HTML in a browser and hack on this.
Installation
A pre-installed Raspberry Pi image can be downloaded and this must be written out to a Micro SD card that is at least 8GB in size. On Windows this can be done using a tool such as Etcher. With Linux this can be done via the command line using dd. The process of writing out the pre-installed image is just the same as writing out a regular Raspberry Pi OS image.
At some point the installation process will switch to first installing the latest standard Raspberry Pi OS release, then booting this and running an application installer script. This will mostly bring benefits in terms of project maintenance and not having to distribute large whole OS image files.
Configuration
The Air Quality application is configured via the file:
/boot/aq/aq.tomlConfiguration has been placed on the /boot partition since this is formatted fat32, which means that it can be mounted on Windows computers, as well as Linux and Mac, for ease of editing.
Let’s take a look at configuration options, starting with the main ESDK hardware section.
[ESDK]
friendlyname = "bjonesoffice"
gps = false
latitude = 53.7129968
longitude = -1.9392022
debug = false
The friendlyname is as it suggests and simply a convenient label to use for the device. Ideally this should be something meaningful, e.g. a combination of the owner name and a location, but it’s not critical and doesn’t have to be globally unique, since the Raspberry Pi hardware serial number is used as the primary means of distinguishing one set of ESDK hardware from another.
If “gps = true” is set and the GPS receiver has a position fix, this will be used to tag sensor readings with the location. However, if this is set to the default of “gps = false”, a hardcoded latitude and longitude will be used instead. This is the default as mostly indoor usage is planned initially.
There is also a debug option, which is disabled by default.
[local]
csv = false
Next there is a section for local logging and at the present time this has just one option, to enable logging sensor readings to CSV files under /aq/data/. This is located on a dedicated partition formatted with the ext4 journalling filesystem. The CSV files generated will need to be either copied over the network using scp (e.g. on Windows via WinSCP), else copied by shutting down the Raspberry Pi, removing the Micro SD card and then inserting it into another Linux computer.
[mqtt]
broker = "localhost"
basetopic = "airquality"
username = ""
password = ""
By default MQTT is configured to publish to a broker running on the Raspberry Pi, without any authentication configured, as show above. This can easily be changed to use a remote broker, enable authentication by setting a username and password, or to set a different base topic.
[prometheus.global]
instance = ""
key = "”
url = "prometheus-prod-01-eu-west-0.grafana.net/api/prom/push"
interval = 300
There may be one or more prometheus.* sections and these configure threads which write sensor readings to remote Prometheus time series database s. The above example is missing the required instance ID and API key values. The interval parameter determines how often sensor data will be written, e.g. in this case every 300 seconds or 5 minutes. Prometheus is not configured by default and this is something which will be covered in the article which looks at the cloud platform.
Updates
For this initial alpha release the Python code is simply executed from under the pi user home directory and updated via “git pull”. However, the application will be packaged in due course and a more convenient update mechanism is planned. This will likely be rolled out at the same time as switching to using a stock Raspberry Pi OS with a script to then install the Air Quality application.