The Interactive Air Quality Map Part 2: Making a Mobile ESDK Air Quality logger
Follow project
 Dave from DesignSpark
How do you feel about this article? Help us to provide better content for you.
Dave from DesignSpark
Thank you! Your feedback has been received.
Dave from DesignSpark
There was a problem submitting your feedback, please try again later.
Dave from DesignSpark
What do you think of this article?
 A big part of the air quality map is the live data it needs to operate, in this article I'll walk you through how I've converted my ESDK to a mobile air quality data logger, it should also be quite interesting to collect some real-time data.
Hardware and Connections
Unfortunately, I did not receive a GPS antenna with my sensor kit, so I could not use the GPS position function conveniently built-in with ESDK, luckily my plan isn't dependent on having it, as I already purchased a GSM/GPRS/GPS module to interface with the kit, I figured if I was going to be collecting live sensor data on the move, mobile internet would be essential, so, I got the A9G module with GPRS and GPS functions.

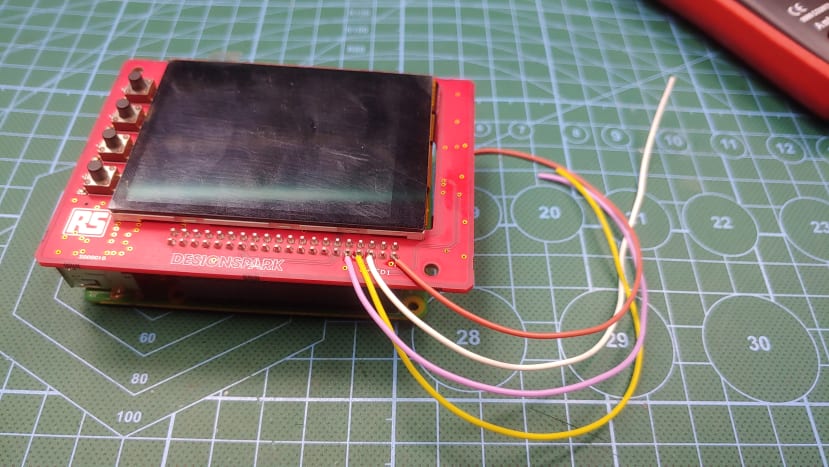
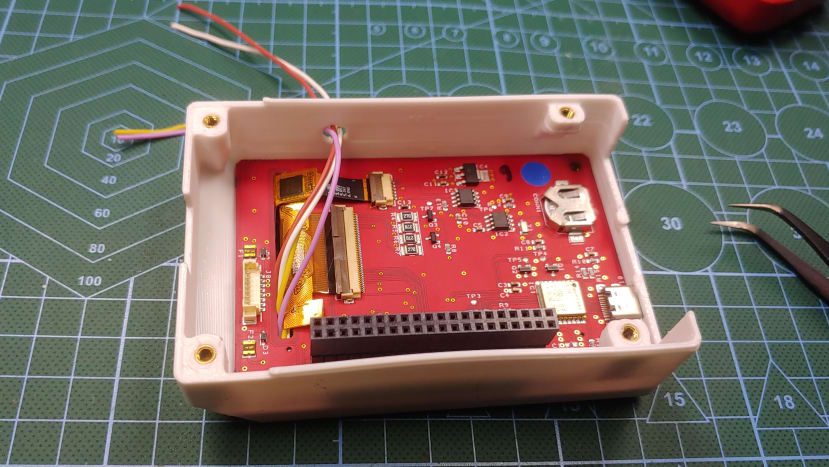
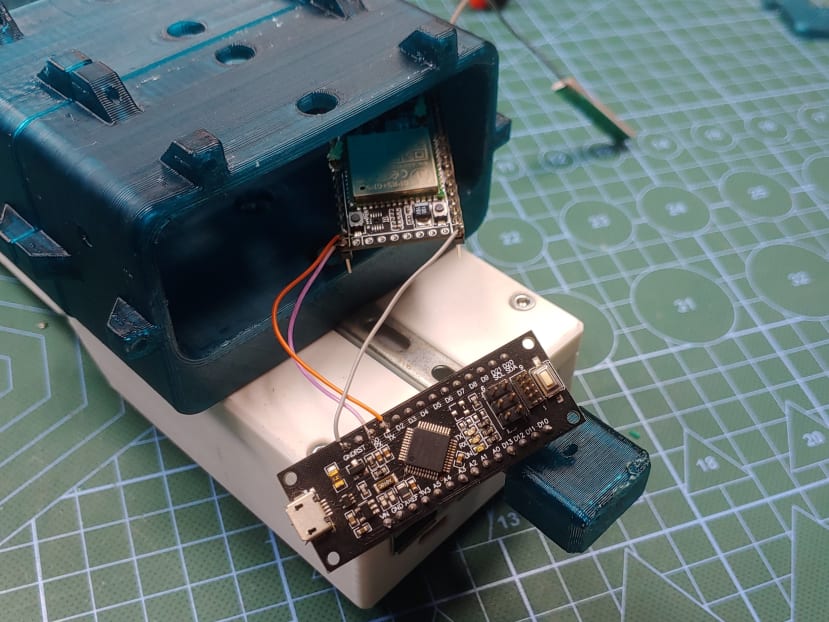
The A9G module is controlled via predefined commands called AT commands sent over serial, GPS data from the module can also be read on this serial connection. I took apart my ESDK and broke out the required serial lines, as well as 5v and GND.
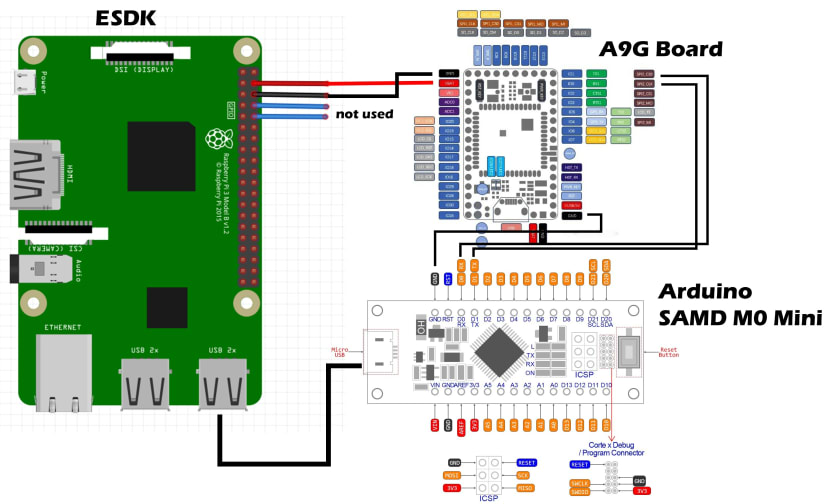
My plan was to have a separate python script running on the pi, reading the GPS data from the module and appending it to the air quality data read from the sensor kit, the Implementation, however, was not so straightforward; for one, I found out I could not communicate with the A9G module directly from the Raspberry Pi's serial pins due to timing and synchronization issues, so the only way I could communicate with the module from a raspberry pi was to use a USB to serial adapter (FTDI) which I, unfortunately, did not have on hand. I wasn't going to let that stall me tough, so I reprogrammed one of my Arduinos as a serial relay, I could then connect the Arduino to the Raspberry Pi, which then relays serial data to and from the A9G module, similar to a regular USB to serial device, but done via software. You’ll see my connections below, and the code will also be attached to this article.
Powering The Mobile ESDK Logger
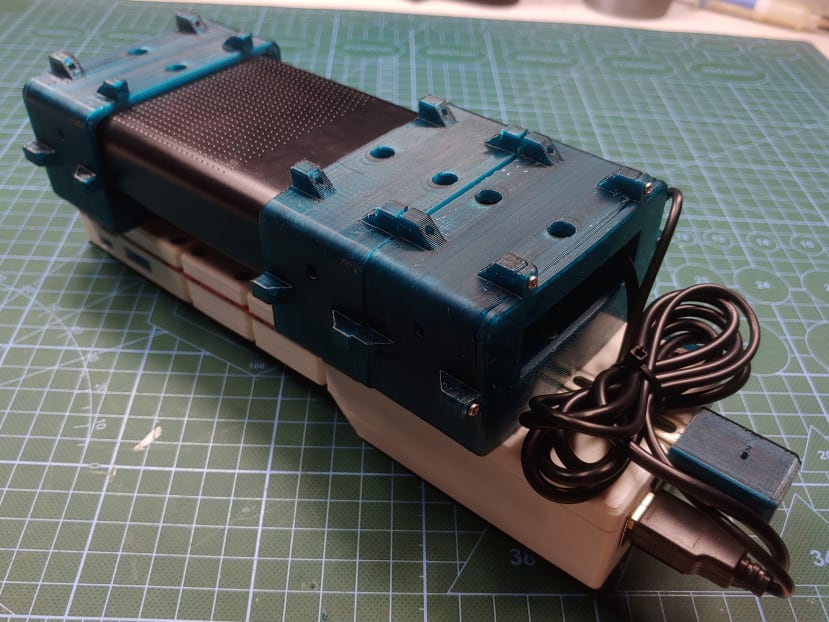
For the ESDK to be mobile, I need a way to power it on the move; for this, I got a pretty beefy 27000mAh power bank, I then modeled and printed a few parts to help attach the power bank to the kit.
The Software
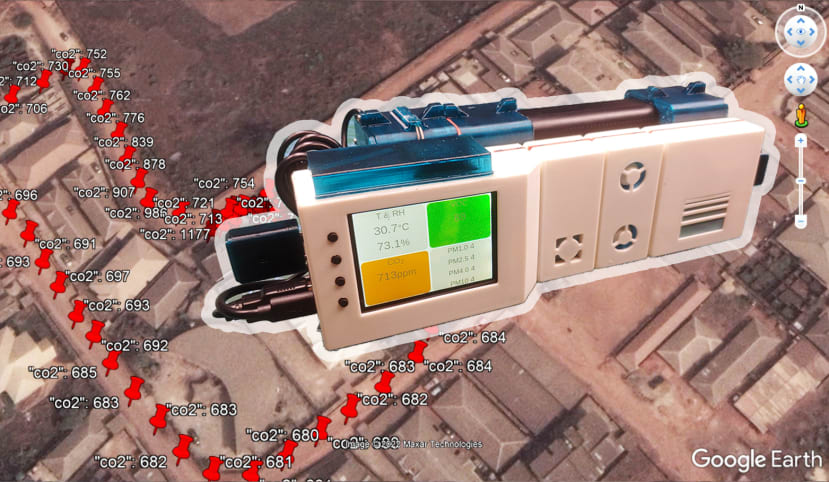
The python script running on the pi has a simple task, it reads the sensor data via MQTT from the ESDK, it also reads the GPS data from the A9G module and then concatenates the information into a single string, which is then written into a .csv file, I have also programmed the script to create a .kml file from the GPS data and the sensor data, this way I get a normal excel sheet as well as a file (.kml) which I can load directly into google earth to be able to properly visualize the live data from the kit.
The code has four main sections:
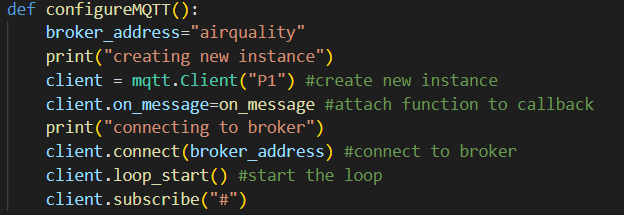
The first is the MQTT setup, this allows the script to connect to the ESDK's MQTT broker to get the actual sensor readings.
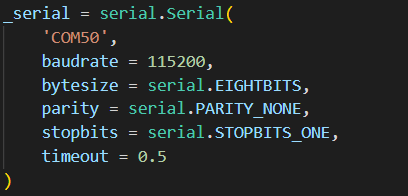
The second section is the serial communication setup section. Here, I simply set up the raspberry pi to communicate with the Arduino that I'm using as the makeshift USB - serial adapter, it’ll work just the same if I use a proper FTDI module.
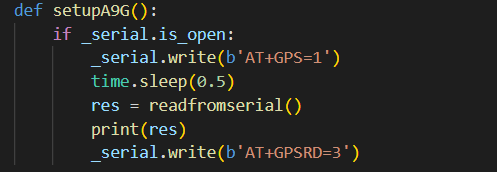
The third section of the code sends some basic AT commands to the GPS board so we can get it to start reporting its GPS data over serial.
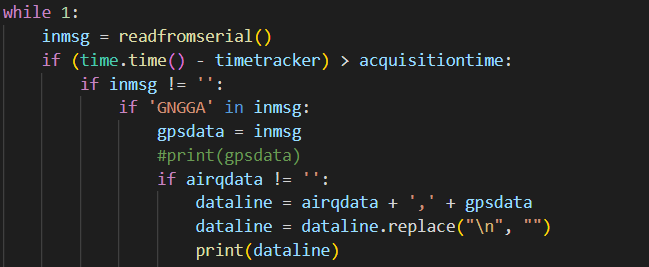
The main code loop is where all the cool stuff happens, the first thing I do is check if there is usable data to process, hence all the if statements.
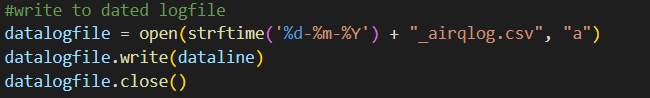
If there is valid air quality data from the kit as well as valid GPS data from the A9G board, the next three code lines joins the air quality data and the GPS data into a single string, which is then written into the .csv log for that day, the line “datalogfile = open(strftime('%d-%m-%Y') + "_airqlog.csv", "a")” ensures that only one csv is created per day, so the script will not generate a new file whenever the kit is restarted on the same day.
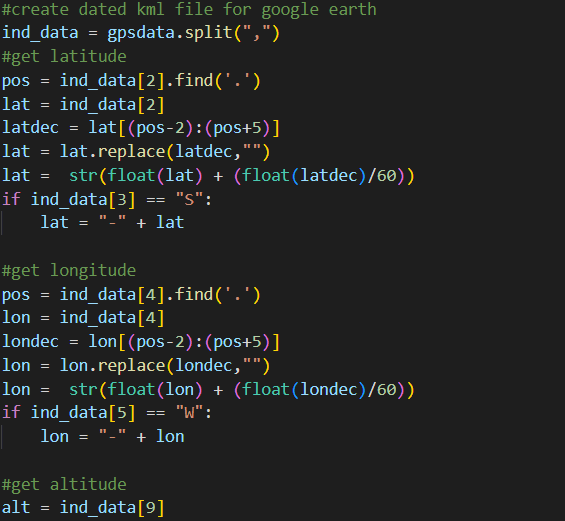
After writing to the csv file the script proceeds to write to the .kml file, kml files require latitude, longitude and altitude to generate a valid point on a map, so I have a few lines of code that’ll extract the longitude, latitude, and altitude from the NMEA data format reported by the A9G board.
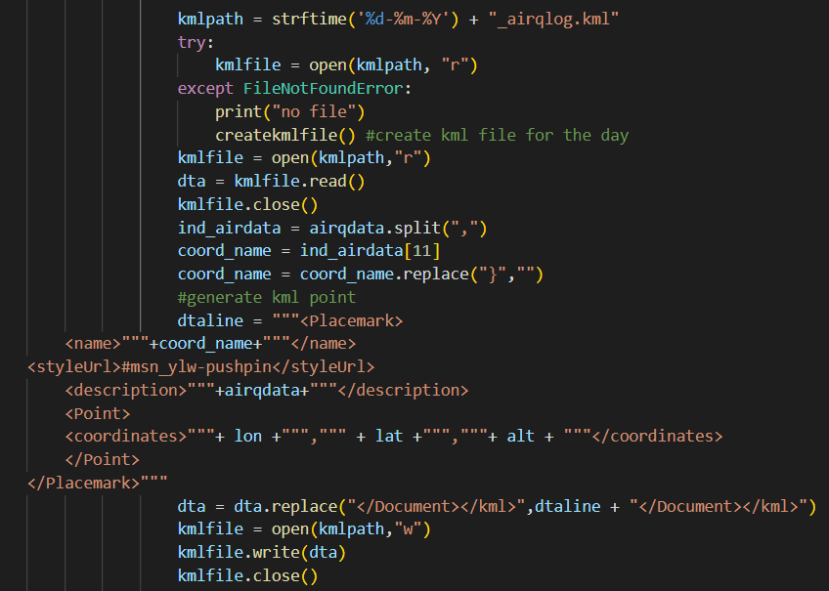
The kml file is a very specific type of file so I am doing some convoluted string formatting to get the file just right for google earth to read it properly, I’ll recommend reading more about kml files here to better understand the file format and syntax, my full code is also attached to this article for your reference.
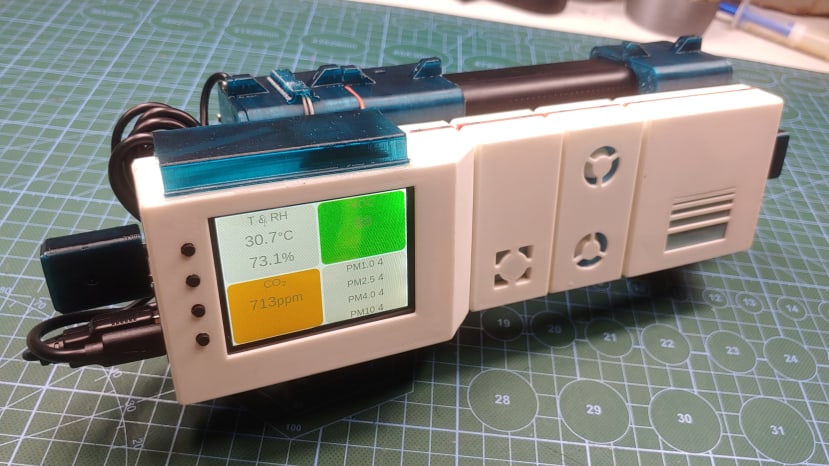
I want to also point out that the ESDK is designed for indoor air quality measurements, and for that purpose, the combination of sensors currently featured on the kit is perfect, however, in an outdoor environment: CO2, VOC, Temperature, Humidity, and Particulates are not quite enough to tell the whole story, Carbon monoxide (CO) and Nitrogen dioxide (NO2) would be more telling in an outdoor air quality logger, so I'll probably find a way to implement those sensors soon.
All the CAD and Code I used in this article will be attached below, so feel free to reference them as needed.
For more information on this project, Part 1 of this series, discusses making the cells for the Air Quality Map.