How To use an Oscilloscope as a Curve Tracer
Follow article
 Dave from DesignSpark
How do you feel about this article? Help us to provide better content for you.
Dave from DesignSpark
Thank you! Your feedback has been received.
Dave from DesignSpark
There was a problem submitting your feedback, please try again later.
Dave from DesignSpark
What do you think of this article?
How To use an Oscilloscope as a Curve Tracer
Engineers typically use oscilloscopes to view plots of voltage-versus-time. However, Keysight scopes are also capable of displaying voltage-versus-voltage by using their "X-Y mode". These scopes can also display current-versus-voltage, or flow-versus-pressure when current probes or other transducers are used.
One useful application of X-Y mode is to plot the I-V characteristics of a semiconductor device. Unlike a simple passive component such as a resistor, semiconductors such as diodes have non-linear regions and it’s useful to understand their behaviour when different voltage or current is applied. Dedicated instruments that perform such measurements are known as curve tracers, but we can also perform the same task and make the same measurements by using a day-to-day oscilloscope and a signal generator. As most of Keysight’s InfiniiVision oscilloscopes come with a built-in function generator, it now it’s possible to do this using only one instrument.
Set the function generator to a sine wave with 4Vpp with a 2V dc offset. The frequency doesn’t matter too much, but you may want to keep it low to minimize distortion or noise as some signal sources provide better performance and lower frequencies. A neat trick is to use an LED and so you can see it illuminate and trace the curve at the same time.
Begin by applying the signal generator to the diode. Probe the voltage across the terminals of the diode with channel 1 (the X input), and the current through the diode with channel 2 (the Y input). You’ll need a current probe such as the Keysight 1147B clamp-on current probe, RS code (667-7417) . If you don’t have a current probe, then you can measure the voltage drop across a small-value shunt resistor and calculate the current drawn by using Ohm’s law.
First, you will see the two signals as Volts -v- time, the “normal” oscilloscope view. You may want to auto-scale and then rescale the two signals for best resolution. It should end up looking something like this:
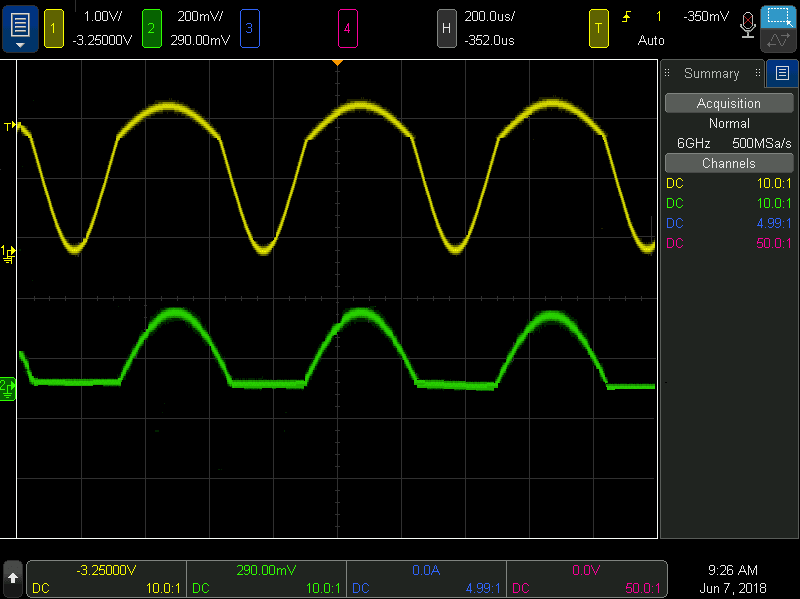
The yellow trace, channel 1 is the voltage. The green trace, channel 2 is the current.
Now display this as voltage -v- current: change the time base setting to X-Y mode (in Keysight scopes, you’ll find this in the acquire menu).
Usually, the waveform starts off quite small won’t be centred on the screen due to the offset of the signal, so you can adjust the oscilloscope’s offset controls to centre the trace on the screen. You can change the V/div on the scope to increase the size of the waveform to see it more clearly.
You can then start to increase the offset or amplitude on the waveform generator to see more of the characteristics of the diode. An example is below – forward conduction is shown just as we would expect from the datasheet.
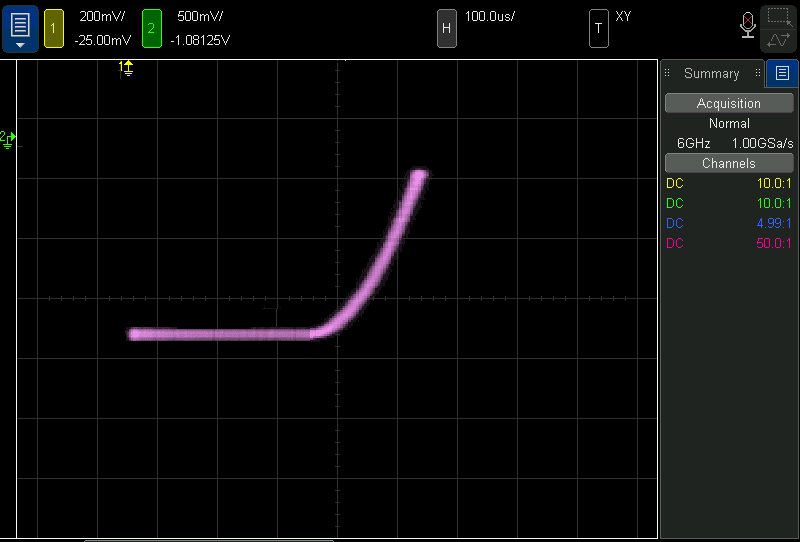
Note that outright accuracy using this approach is not the main aim, engineers can understand the characteristics of the diode by the shape of the curve alone – and by changing the offset and range it’s easy to demonstrate or analyse the characteristics further.
And that’s it! How simple is it to add yet more capability to your oscilloscope, and save on the cost of another instrument!
Now, what else can your oscilloscope do…?
Visit the Keysight oscilloscopes page for further information.