Design Calculations and Testing of Basic Filters
Follow article
 Dave from DesignSpark
How do you feel about this article? Help us to provide better content for you.
Dave from DesignSpark
Thank you! Your feedback has been received.
Dave from DesignSpark
There was a problem submitting your feedback, please try again later.
Dave from DesignSpark
What do you think of this article?
Looking at designing low and high pass filters & testing these with the Analog Discovery 2.
In a previous post, Familiarising Myself with Filters. I looked at some of the various different types of electronic filters, what they do and their applications. This included both basic low pass and high pass filters. To gain a better understanding of their design and how they work, in this post I will look at the calculations behind determining their cutoff frequencies, before putting it to the test.
Low pass Filters
To begin with I’m going to take a look at a low pass filter. A low pass filter passes all frequencies below a certain cutoff point and blocks those above it.

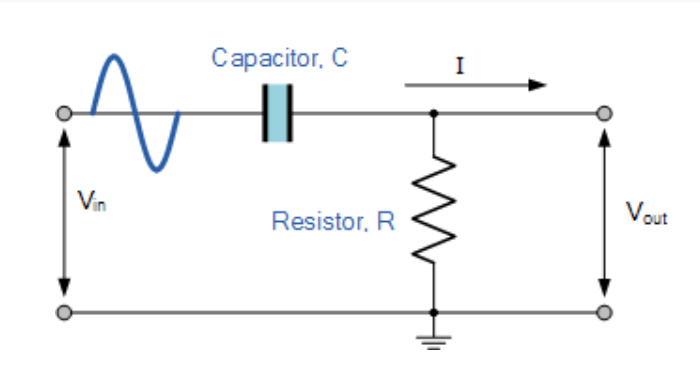
This is a passive filter and consists of only a resistor and capacitor in series. In order to determine the component values needed to achieve a certain cutoff frequency we use the formula:
Fc = 1 / 2PiRC
There are several ways which this formula can be rearranged to make either C or R the subject, the following is what I’ll be using:
Fc2PiR = 1/C
Let’s say for this application we want to estimate a cutoff frequency of 1KHz (1000Hz), and we’ll assume a resistor value of 10KΩ. Substituting these values into the formula we get:
1000 x 2 x Pi x 10,000 = 1/C
1000 x 2 x Pi x 10,000 = 1/62831835.07
This results in a capacitor value of 15.9x10⁻⁹ F or simply 15.9nF
As I do not have a 15.9nF capacitor available I will use the closest capacitor value I can find, this being 15nF. As this isn’t the exact capacitor value needed for a cutoff frequency of 1KHz, I am going to use the original equation with this capacitor value and a 10KΩ resistor to determine what the actual calculated cutoff frequency should be.
Fc = 1 / 2PiRC
Fc = 1 / 2 x Pi x 10,000 x 15x10-9
Fc = 1061.03Hz or 1.06KHz

Here this filter should pass approximately all frequencies below 1.06KHz and stop those above it, taking account the knee of this filter design.
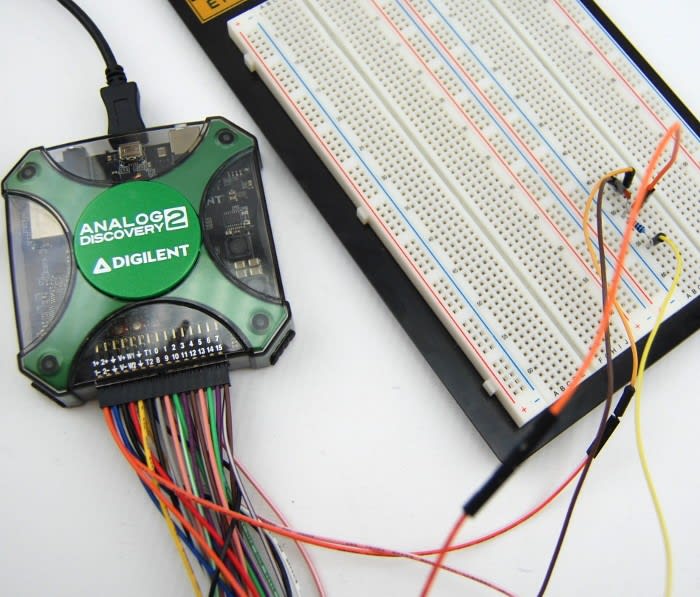
To test this I connected the Analog Discovery 2 to the circuit. The Wavegen probe was connected to the input of the resistor, with the scope probe connected to the junction of the resistor and capacitor and then grounded to the other side of the capacitor.
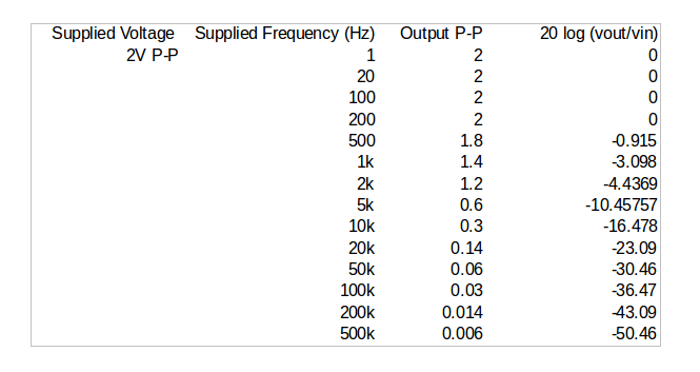
I set Wavegen to source a sine wave with an amplitude of 1V (2V P-P) over a range of frequencies starting at 1Hz all the way up to 500KHz. The results are as follows:
I then plotted the gain against the frequency so I could visualise the response curve

Here we can look at a smaller range of readings around the cutoff frequency in order to get a clearer view of the knee curve.

This was then repeated with smaller and smaller ranges of readings until the knee of the frequency response curve was clear enough to see.

From looking at the frequency response graphs and the table for the low pass filter designed, we can see that frequencies of up to 200Hz are passed and that somewhere between frequencies of 200Hz and 500Hz attenuation begins. Therefore this filter is acting as it should and working as a low pass filter, passing frequencies below it’s cutoff frequency and blocking those above it.
High Pass Filters
Like the low pass filter we just looked at, the simple high pass filter I am going to design is also passive, and consists of only a capacitor and resistor capacitor in series.
In order to determine the component values needed to achieve a certain cutoff frequency we use the formula as we did for the low pass filter:
Fc = 1 / 2PiRC
Once again we need to rearrange the formula in order to make capacitance (C) the subject:
Fc2PiR = 1/C
As this is a high pass filter lets say we want to pass all frequencies above approximatively 2KHz, this will block all frequencies below this cutoff frequency. Substituting this frequency in and once again assuming a resistor value of 10K we get:
2000 x 2 x Pi x 10,000 = 1/C
2000 x 2 x Pi x 10,000 = 1/125663706.1
This results in a capacitor value of 7.9577x10⁻⁹ F or simply 7.9nF.
As I do not have a 7.9nF capacitor available, I will once again use the closest capacitor value. The closest values which I have available to hand are either a 6.8nF or 10nF, for the purposes of this filter I will use the 6.8nF capacitor as this is closest to the calculated value needed for an approximate frequency of 2KHz.
As previous, I will once again work back with these component values to determine the actual calculated cutoff frequency. Using a 10KΩ resistor and a 6.8nF capacitor this should be:
Fc = 1 / 2PiRC
Fc = 1 / 2 x Pi x 10,000 x 6.8x10-9
Fc = 2340.51Hz or 2.34KHz
Knowing this I should expect this filter to pass frequencies above the 2.34KHz mark and block frequencies lower than this.

Once this circuit was constructed on breadboard I repeated what I completed previously to test the filter, again using the Analog Discovery 2.
The Wavegen probe was connected to the input of the capacitor, the scope probe was connected to the junction of the resistor and capacitor and this was then grounded to the other side of the resistor. Again Wavegen was set to source a sine wave with an amplitude of 1V (2V P-P) over a range of frequencies from 1Hz to 500KHz. The results are as follows:

Below we can see a plot of the gain output against the frequency supplied.

Once again we can look at a smaller sample of the results around the cutoff frequency in order to get a better view of the knee of the curve.

Instantly we get a better view of the knee of the frequency response curve, but by looking at an even smaller sample still we are able to see this in more detail from the range of frequencies tested.

From looking at the frequency response graphs and the table we can see that frequencies greater then 5KHz are passed, while frequencies below this point at blocked to some extent. Here we know that the cutoff frequency of this high pass filter should be around 2.34KHz, while some frequencies at and above this point are being attenuated it is within the normal range for the cutoff frequency to be -3db, which this is around.

Sweeping Signal Generator
When I was playing around with the WaveForms software one on the things I noticed which the Wavegen function is that you can set this to sweep, then you can use the spectrum analyser to view a plot of the response. I wanted to have a go at sweeping the frequency over a range in order to see the frequency response curve without taking lots of manual readings and then plotting these myself. Doing this means that in theory the plot would be much clearer, as this would also test the intermediate frequencies of the points manually measured.
I first connected the low pass filter up to the Analog Discovery 2, with the waveform generator connected to the input of the resistor and the oscilloscope probe connected to the junction of the resistor and capacitor. The other side of the capacitor was then connected to GND and the scope channel 1 negative was connected here too.
I set the Wavegen to sweep between 1Hz and 500KHz, and below we can see the plot of this on the spectrum analyser.

Here we can see the frequency response on the sweep is similar to that which was plotted of the individually measured results.
We would be able to see a much clearer knee of this sweep if the cutoff frequency hadn’t been so low. If we had set the cutoff frequency of this low pass filter to around 500KHz we would be able to see the pass band and stop band much more clearly on this scale.
What I really enjoyed about this is seeing the capabilities of the software and how much easier being able to sweep a signal makes analysing the frequency response of circuits. I wanted to manually take measurements at first, but once I ran the sweep it was soon clear how much easier and quicker this was.
I’m really looking forward to using the Analog Discovery 2 more in future circuit analysis and learning how to work with the software to get the most out of it!