Using Tektronix MSO/DPO2000 Series Oscilloscopes to analyze circuit malfunction
Follow article Dave from DesignSpark
How do you feel about this article? Help us to provide better content for you.
Dave from DesignSpark
Thank you! Your feedback has been received.
Dave from DesignSpark
There was a problem submitting your feedback, please try again later.
Dave from DesignSpark
What do you think of this article?
The MSO/DPO2000 Series Oscilloscopes delivers the performance, affordability and portability that enable us to tackle many kinds of challenges – quickly and easily. These oscilloscopes help us solve problems by visualizing circuit behavior, accurately capturing signals, and enabling us to analyze the acquired waveforms to determine the root cause of circuit malfunction. And we will introduce specially the functions of analyzing the acquired waveforms to determine the root cause of circuit malfunction by using the MSO/DPO2000 Series Oscilloscopes.
Looking for Unintentional Circuit Noise
Engineers and technicians often need to check for unintended noise in their prototypes. However, noisy signals can be difficult to analyze in the time domain, as shown. The MSO/DPO2000 Series Fast Fourier Transform (FFT) is a powerful tool for identifying sources of noise in a circuit. The FFT enables the user to break down signals into component frequencies, which the oscilloscope uses to display a graph of the frequency domain of the signal. With this information, developers can then associate those frequencies with known system frequencies, such as system clocks, oscillators, read/write strobes, display signals, or switching power supplies.
To examine a noisy signal in the frequency domain:
- Press the front panel Math button.
- Press the FFT menu button.
- Select the Rectangular Window, which provides the highest frequency resolution on broadband noise signals.
- If desired, use the multipurpose knobs to adjust the vertical and horizontal position and scale of the FFT waveform.
- In this case, the two highest peaks in the FFT indicate that there are significant sources of noise at 6 kHz and 15 kHz. In this case, these are system clocks, which are coupling into the signal.

Analyzing Power Line Harmonics
Power circuit designers often need to analyze the effects of their circuits on the power line. Although an ideal power supply would present a constant load on a power line, real power supply circuits do not, creating harmonics on the power line. The MSO/DPO2000 Series and its recommended accessories such as the TCP0030 and TCP0150 current probes provide powerful tools to easily measure power supply currents and analyze the harmonics on a power line.
To display the power line harmonics on a current waveform using the TCP0030 current probe:
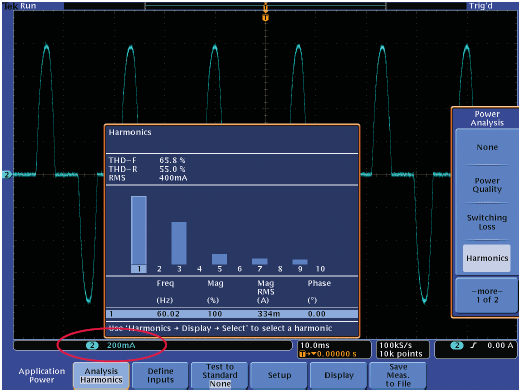
- Connect the TCP0030 current probe. Notice the blue readout at the bottom left of the display, where the waveform’s vertical units have been automatically set to milliamps (mA) by simply connecting the probe.
- Press the Test front panel button.
- Press the Analysis menu button and select Harmonics.
- The Harmonics graph is displayed. You can select different harmonics on the graph to see their frequency, magnitude and phase. Or you can view a table listing all harmonics and their key parameters.
Measuring Switch-Mode Power Circuits
Designers of switch-mode power conversion products often need to analyze the instantaneous power dissipated in components in their designs, a measurement that is only possible with an oscilloscope.
The MSO/DPO2000 Series’ long record length, signal conditioning, and complete portfolio of measurement accessories such as the TDP0500 high-voltage differential probe or TDP1000 differential probe and TCP0030 current probe provide powerful tools to easily measure switch-mode power circuits.
To display the instantaneous power dissipated in a switching device using the TDP1000 differential probe and TCP0030 current probe:
- Measure the voltage across the switching device with the TDP1000 differential probe.
- Measure the current flowing through the device with the TCP0030 current probe. Notice the mA units on the blue readout at the bottom left of the display.
- Press the Acquire front panel button and select the Hi Res acquisition mode to reduce noise on the signals.
- Press the Test front panel button.
- Press the Analysis menu button and select Switching Loss.
- A table showing Turn On, Turn Off, Conduction and Total power loss and energy loss is displayed. The oscilloscope will automatically calculate these values for multiple switching cycles in the waveform and display the Mean, Min and Max statistics across the different switching cycles.
